APE USDT PERP Hello Trader BINANCE:APEUSDT.P
look from the 15-minute chart
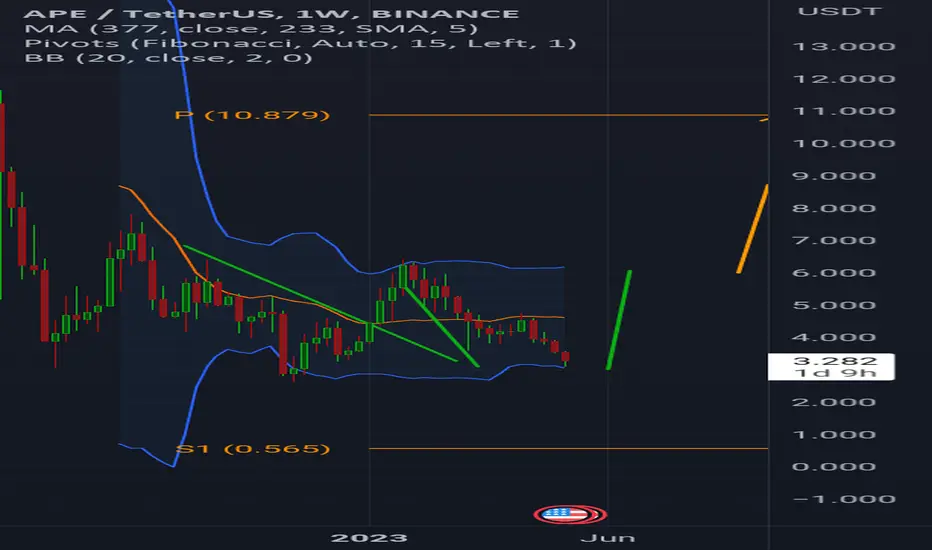
you can go short because there is still
potential to go down, look at the
entry point area that I have determined.
Hopefully can
Please add a comment and Positive feedback and
constructive criticism are important to authors and the
community.
Disclamer: Not Financial Advice
APEUSDT trade ideas

Bullish Harmonic Pattern and RSI Divergence Potential ScalpOur attention has been drawn to the 15-minute chart of APE, which is exhibiting a harmonic pattern and RSI bullish divergence. This could provide a potential scalp trading opportunity. Please note that this is not financial advice and always consider the inherent risks associated with trading.
Idea :
On the 15-minute chart of APE, a harmonic pattern has been detected. These patterns can often predict potential price reversals due to their alignment with Fibonacci numbers, making this an interesting setup to watch.
Adding to the bullish scenario, the RSI (Relative Strength Index) is showing bullish divergence. This occurs when the price makes lower lows, but the RSI makes higher lows, which can often signal an upcoming bullish reversal.
Considering these two technical factors, a quick scalp trade could potentially be executed. Scalping is a trading strategy where small profits are taken regularly to exploit short-term movements in the price. However, remember that while the gains can add up, the losses can as well, and scalping requires a strict exit strategy to protect against potential downturns.
If this setup triggers and you decide to enter, ensure you have a clear stop loss in place and take profit levels defined. This will protect your capital and lock in gains when the price moves in your favor.
This post is for educational purposes only and is not investment advice. Please do your own research before making any investment decisions. Cryptocurrency investments carry significant risk and may result in a loss of your capital.


APEUSDT Looking bullish (Long position)Based on my analysis I believe this is the end of the correction and it's gonna move upward from here!
NFA

50% for APEMarket looks strong even after bad news and FUD. I like APT with nice R:R. If you need any help, contact me.
MANAGE YOUR RISK AND USE STOPLOSS
NOT A FINANCIAL ADVICE

#APUSDT by Ilya (Watchlist) 6-2023
Current price: $3.15
Sector: Metaverse
Market capitalization: $1.16 billion
Circulating supply: 368.59 million
All-time high (ATH): $27.51 (April 30, 2022)
All-time low (ATL): $0.003 (July 20, 2021)
Add BINANCE:APEUSDT
to your watchlist.
When we suggest adding a coin to your watchlist, it means it's forming a pattern or approaching a historical bottom, near or above a good support level, displaying increased trading volume, showing a reversal candle, in an accumulation stage, etc. However, we haven't seen any bullish reaction yet, so we recommend adding it to your watchlist until the right time for entry.
Note:
This isn't financial advice, but an analysis of coin movement (not a buy or sell signal). Before following any ideas, do your own research and practice good risk management.
You can't impose your opinion or force it to happen in the cryptocurrency market. So, be prepared for any outcome.
Remember, the cryptocurrency market is highly volatile and involves both gains and losses. Understand the risks before investing.
Good luck to everyone, and we hope that Allah reconciles and repays us all. 🙏

I position myself confidently in the realm of $APEWith an unyielding bullish spirit coursing through my veins, I position myself confidently in the realm of APE, propelled by the resounding potential it exudes. With a keen eye on the horizon, I patiently await the opportune moment to seize profits above $3, guided by the monumental presence of a TWAP-er that promises to pave the way to unprecedented gains.


APEUSDT coin will be in the accumulated rangeAPEUSDT best point of entry between supply zone area as shown in yellow then it will be accumulated between 10% fib to 55% fib level.
We issue prediction after careful analysis. You can enter after doing your own analysis. We are not responsible if company fraud happens. We issue analysis on public demands.

APE usdtWe have positive divergence, but wave 3 seems to be completed, we have wave 4 and shortened wave 5 senario 2

APE usdtWe have positive divergence, but wave 3 seems to be completed, we have wave 4 and shortened wave 5

🔥 APE Crazy Bullish Divergence: Best Trade Of The Summer!APE has been roughly selling off since the start of the year. This trade anticipates that the selling is over and that the bottom is in for the time being. The idea is that the massive bullish divergence on the price vs RSI will cause a huge uptick in bullish pressure, further reassured by a bullish long-term BTC and stock market.
When we place the stop below the current daily low of 2.99 and a target of 6.40 (the year to date high), we can create a trade with an insane risk-reward of almost 26. This can potentially be one of the best trades of the summer.
Based on your preference you can take partial profits around 3.50 and 4.60


APE USDT PERP Hello Trader 👋, today we are looking to BINANCE:APEUSDT.P
direction : long
entry 3.393
stoploss 3.259
leverage : cross 25X
take profits
3.512
3.586
3.646
3.706
3.790
3.899
Please add a comment and Positive feedback and
constructive criticism are important to authors and the
community.
Disclamer: Not Financial Advice

APEUSD ❕ broke down the trend lineAPE came out of the descending channel.
The asset reversed from the resistance level.
The price has consolidated under the trend line.
I believe that the asset will continue to decline.

apeMaybe it is such a plan. At first glance, it is broken and we are waiting for confirmation. It has a small one-hour support in the numbers below.

APE ANALYSIS (1D)Hi, dear traders. how are you ? Today we have a viewpoint to BUY/SELL the APE symbol.
For risk management, please don't forget stop loss and capital management
When we reach the first target, save some profit and then change the stop to entry
Comment if you have any questions
Thank You

APE| Bulls May Target 4.55 In The Coming MonthsAPE| Bulls May Target 4.55 In The Coming Months
Since the price broke a strong support zone
from the middle of April 23 did not stop until now.
We can see that the price is close to another strong support area considering that the bearish movement is slowing down.
In the same area, we can also see a bullish harmonic pattern that can be considered complete.
If the bullish move starts, the price will reach 4.55 in the coming months.
Thank you and Good Luck!

Ape touched weekly bands - bottom?Expanding on Ape here after the corrections, the initial inverse head and shoulders gave great results and now we are back at a great spot for a low risk long entry.
In case of a win this is a big hold here, as it could be the absolute bottom.
I am taking the long and will be happy to book a loss, in the face of all the rewards that are possible.
Do not all in, make sure you are willing to lose, but this seems like a great opportunity and I'm doing my best to catch this puppy too.

APE LONG IDEAIf price enters the range again after the deviation, we can try LONG.
Take your risk, make some profit !
