APE - Take Some Profit Next Week I'm not fudding $APE, its one of only 5 altcoins I own. But I think its gonna wreck late / FOMO buyers later in January or February after the mint.
High staking emissions; hype growing like repeat of Otherside when APE dropped >80% in the 5 weeks after. Yuga vesting also unlocks in March.
Be careful, take some profit.
APEUSDT trade ideas

APE (try to breakout)APE/ USDT
Another try to breakout the 8 months resistance
(5 attempts in total which increase the chance of the breakout this time )
Keep an eye

APEUSDT SHORtPrice engineered liquidity, took out liquidity, reacting to 8hr supply zone.. Short target previous swing lows

APEUSDT TO THE MOONBINANCE:APEUSDT
#is this monkey going to the moon? YES IT IS.
it will reach the 4.5 level soooooon...HOLD ON!
#STOP_BEING_POOR

APEUSDTHello dear friends
On the daily time frame, the positive divergence of the RSI with the downtrend line has created a bearish wedge pattern for us. Until the $5.584 range is fully consumed, the bullish outlook is weak.
But if the range of $2.618 is maintained, we can hope for the completion of the wedge pattern.
On lower timeframes, the drawn bearish scenario is very likely. However, if the range of $2.618 is maintained, the possibility of a bullish scenario will also be strengthened.
We would be happy to hear your comments

APE: Channel Down BreakoutTrade setup : Bullish breakout from Channel Down pattern and above $4 resistance, which confirm the channel breakout and price could revisit $5 next. (set a price alert).
Pattern : Price is trading in a Channel Down pattern. With emerging patterns, traders who believe the price is likely to remain within its channel can initiate trades when the price fluctuates within its channel trendlines. With complete patterns (i.e. a breakout) – initiate a trade when the price breaks through the channel’s trendlines, either on the upper or lower side. When this happens, the price can move rapidly in the direction of that breakout.
Trend : Uptrend on Short-Term basis and Downtrend on Medium- and Long-Term basis.
Momentum is Bullish ( MACD Line is above MACD Signal Line and RSI is above 55).
Support and Resistance : Nearest Support Zone is $3.00. The nearest Resistance Zone is $4.00, which it broke, then $5.00, and $6.00.

Short APEHello traders!
Welcome back to another episode with Analyst Aadil1000x
Today we are shorting another pair which is APEUSDT because of the reversal pattern and change of structure.
Target 4.089(+14%)
Stoploss 4.846(-1.6%)
Don't forget to hit the like button and follow to stay connected

APECOIN - Under Wyckoff AccumulationWe have broken out of the downward channel to the upside and I am now bullish as that yellow resistance line is now support. And I took a close look at the pattern to potentially identify a Wyckoff Accumulation , to which we may be just making the spring. As long as BTC is going to present a bullish argument, and as long as we hold above $3.20 this pattern could go higher than targeted. Good volume on 4hr, but also maybe overbought on some time frames. Not financial advice, DYOR.

APEUSDT | TRIANGLE BREAKOUT...APE has been trading in a triangle.
The price has been converged.
Now after taking support lower side of triangle, the price has broken above the triangle. .
The bulls can take control from here.
Manage your levels accordingly.


APE falling wedge breakout?!Let's see if APE here can finally get past this resistance and have a big pumperoni! Let the zoo out!

APEUSDT Buy Setup!APEUSDT Technical analysis update
APEUSDT is breaking its resistance trend line.
Buy zone: Below 4.25
Stop loss : $3.87
Take profit 1 : $4.48
Take profit 2 : $4.80
Take profit 3 : $5.25
Take profit 4: $5.75
Always keep stop loss
Thanks
Hexa

Ape Inverse Head and Shoulders (Activated Today)Here we have a breakout attempt from inverse head and shoulders bottoming pattern.
Ape it to 7.3$
God speed ahead!

🔥 APE Falling Wedge Break Out: Pump Incoming?Recently I've made an analysis on APE where I discussed the falling wedge pattern on the chart. As of today the price has broken out of the wedge and retested the top resistance as support, making this breakout even more credible.
I'm looking at $5.30 as my main target, potentially $6.40 if we see some kind of big pump over the next weeks.

APE Mini SIGNALhi, this is my idea for ape movement, i would publish more crypto and forex signals here.

APE coin wave count in 4H time frameHello
Since APE coin started to correct has entered in a WXY wave that has covered waves W and X and in order to fill wave Y as if it's having a double ZIGZAG
At the moment one of the zigzags has been covered we expect that after filling wave B, it'll start another ZIGZAG
This can be more accurate with your opinions
Thanks
Reza

APE USDT shortWe had a great run and APE is performing very well in this bear market, the staking news pushed the price from 2.8$ up to 4.5$ !
I do have some APE coins in spot locked in staking and i am confident in that long term , but meanwhile it s time to retrace for ape, let s give it a closer look:
-1H demand zone hitted and rejected hardly (this means that is a good zone where the is a lot of selling pressure and orders)
-Fibonacci retracement filled 0.5 i don t think we are going to fill 0.618 for now being the 0.5 level the same with the supply zone.
Entry: 4.02
StopLoss: 4.088
TakeProfit: 3.831 (for now ... , might close a 75% position here and let it run the rest towards 3.55 maybe ... i will post updates in case)
Risk reward 3 LEV 10X

APEUSDPrice broke and retested a significant zone, creating a bullish N wave formation. All three moving averages gave me two conformations and an entry signal.

#ape $ape daily#ape picking up steam on the daily breaking out of a significant bearish trend. i see upside here. but i also see 14600 on #bitcoin. how it plays out remains to be seen. could roll and see a double bottom on many alts with a fakeout here on #ape. therefore at this stage its level to level with a bullish bias until invalidation.

Ape good short swing positionhas the potential for a good drop
it can also reach below 2$
use your own stop loss

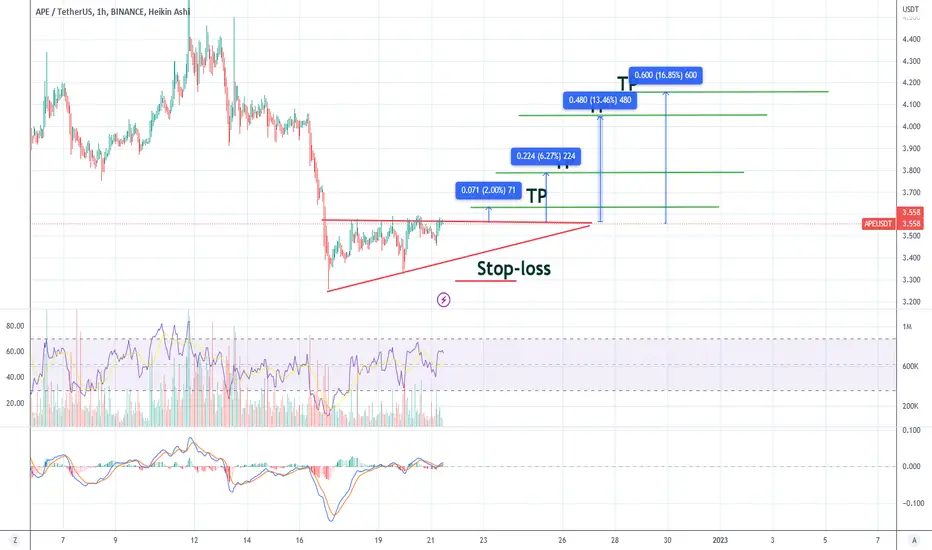
APE/USDT Trading Idea short-termAPE shows some strength. by breaking out of the ascending triangle pattern we can buy some possitions and ride it out till the last TP. Taking profit at the TP points is recommended. SL is set on 3.29
APE completed 2 big technically ItemsHey guys
After breaking the dynamic line by great movement and completing the head and shoulders i hope it will rise more than 90%
everything depends on BTC btw
Bullish market can happen this by good candles closure
Entry prices 3.9 _ 4.1
Gl

APE Scalp Long & ShortTrying to time a good short entry is one of the trickiest tasks we face as a scalper. This task is made a little less stressful if we already have an in-profit long entry by the time price reaches the potential 'shorting zone'. If you get your first 'light' short entry but price reverses and continues up, then great, you are making more on your long than your short so why should you care? Plus you'll get an even better short entry now, so it's all good.
APE may present us with an opportunity to put this into practice over the next few hours. I don't trade triangles, wedges, flags, pennants or any other mainstream technical analysis indicators. I trade market maker manipulation and he has just shown his hand on APE. There is no way to predict when he will strike but once he strikes the evidence of his trickery is clear to see on the charts. The long green wick on my 15 minute chart shows us that there are longs trapped above $3.90. We have no way of knowing how many are trapped but we do know from experience that he will not release them any time soon. He will very likely spend some more time back up there to trap more moonboys long (we are trading APE after all) and that is where we will be presented with an opportunity to enter a short trade.
As always, scalping is a dynamic craft so we readily accept that the price can just keep going up and that is where you will have your own method of handling that scenario. If it happens, then I would probably take a small loss on any shorts at $4 and let my longs ride until I see another opportunity to go short.
