APEUSDTHello Crypto Lovers,
Mars Signals team wishes you high profits.
This is a 4-hour-time frame analysis for APEUSDT
Based on our last analysis on December 11, we predicted a falling trend to happen after a little rise and in this chart the decline has happened after an increase. There are R2 and R1 as our resistance areas which both contain the disability of the price to rise. And S1 is a long-term support area at the bottom that expresses the support of price since the past. Therefore, the price has a fluctuation below R1 and our belief would involve two options here to happen. In case the price is able to provide us some rising signs, there is a possibility of an increase for it to reach R2. Even it is clear that through some falling signs here by the price, the decline will be expected for it toward S1 or lower. We suggest you to wait for some confirmation candles to make sure what the next position will be in the chart.
Warning: This is just a suggestion and we do not guarantee profits. We advise you to analyze the chart before opening any positions.
Wish you luck
APEUSDT trade ideas

APE/USDT waiting for this zone! Hey guys
Quick overview about APE coin as well guys. Simple as it is that resistance zone will define the next movement - if we breakout from that we good to long but if EMA zones will be broken then good for short position. What do you think?
If you like ideas provided by our team you can show us your support by liking and commenting.
Yours Sincerely,
Swallow Team 🔱
Disclamer:
We are not financial advisors. The content that we share on this website are for educational purposes and are our own personal opinions.

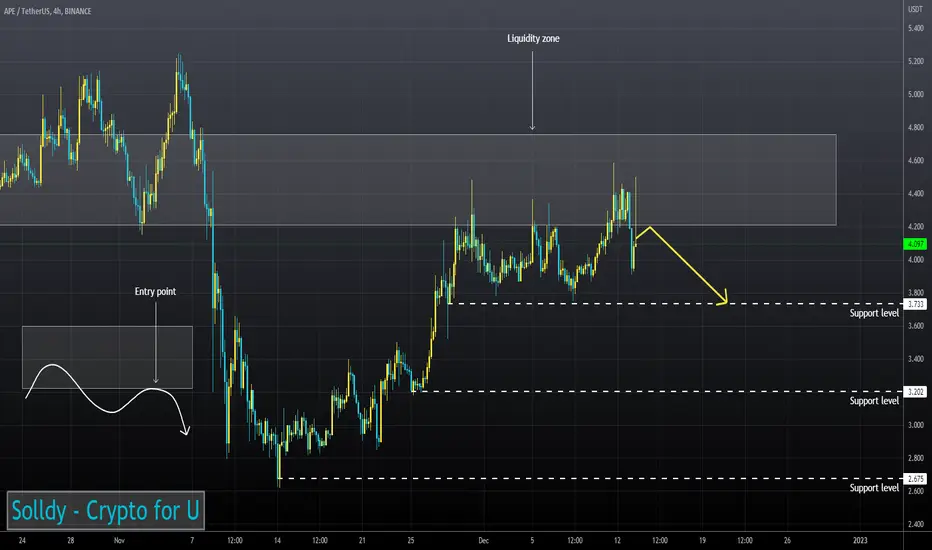
APEUSD ❕ under a liquidityAPE is trading under liquidity and a bearish takeover has been formed on the 4H Timeframe at the peak.
Price and the RSI chart have formed a bearish divergence (4H TF) with the indicator itself signaling a shift of initiative to sellers.
The stock is testing 50EMA as support (4H TF)
I expect a fall after the price fixes under the liquidity zone.
APE BUY SETUPHello, dear traders. how are you ? Today we have a setup to buy/long the APE symbol.
For risk management, please don't forget stop loss and capital management
When we reach the first target, save some profit and then change the stop to entry
Comment if you have any questions
Thank You

ApeCoin (APE) Price Prediction
ApeCoin (APE) Price Prediction 2022
ApeCoin (APE) holds the 33rd position on CoinGecko right now. APE price prediction 2022 is explained below with a daily time frame.
The above chart of ApeCoin (APE) laid out the descending channel pattern, also known as the falling channel . A descending channel is formed by two parallel trendlines . The upper trendline, which joins the highs, and the lower trendline, which joins the lows, run parallelly downwards. This pattern is the characteristic of a bearish market.
Currently, ApeCoin (APE) is in the range of $4.066. If the pattern continues, the price of APE might reach the resistance levels of $5.428. If the trend reverses, then the price of APE may fall to $2.701

APEUSDT Support And Resistance UpdateAs you probably know, I said that you can expect a drop to the rectangular range in the shape of the upward trend line, and if it breaks the upward trend line, it is a confirmation of the downward trend in the price.
that happened .

Ape fell out of the treeHard in the paint painting this chart red with 100X margin puts. This ape ran out of bananas. Yehawwww!!


APE potential good long setupHi everyone,
I will appreciate for ur activity. Thank you!
We need to retest ~3.5$ zone then i expect continuation of growth
Targets: 4.2 - 5 - 5.5
Stop: ~2.7
RR: 1 to 3
I hope my work suits you and you are satisfied.
DYOR!

APEUSDTThe price has reached the downward trend line
Weakness in the trend is evident to break the trend line

APE about to make a strong breakout APE / USDT
From recent price action we can see a 7 months of resistance about to breakout
If breakout done successfully ✔️ , strong bullish wave is expected

APE - steaking put into the projectLast week they introduced stacking. According to observations after stacking, the coin starts to downmoves.
Technically we are above the bear trend.
and below the resistance level of $4.5.
The trendline blues are acting as support and if the price goes near them, the price will most likely fly to $3.5
In any case, there are a lot of layouts.
I will only make a breakdown of this level or trend line.
If you liked the idea, please like it. That's the best "Thank you!" for the author 😊
P.S. Always do your own analysis before a trade. Put a stop loss. Fix profits in installments. Withdraw profits in fiat and make yourself and your
your friends.


APE to the moon?Hey guys, I heard from other traders APE could do it like AXS in the early phase and rock the charts.
Nobody knows...
I believe we will see the ATH soon and take this trade. But I always take profit.
HAPPY TRADING | ALWAYS TAKE PROFIT | NO FINANCIAL ADVICE

APE Bullish !Hello guys so now it is very bullish not only because chart but fundamental its very positive something like AXS coin😊 We need to confirm first green rezistance , after confirm i think we will see big pumps !
Hit me like if you agree and check other analysis !

crypto/usdt if you wanna 90 win stratgy use you dont need to now any thing for this stratgy how its woork evey entry you take you put a stop lose right do not trade just put a lmit sell/buy at your stop lose it will work at any market 5min 15 min h4 D DONT FALL FOR CONFEMATION YOU WILL GONNA GET F

Day Trade on APEWe are heading toward the daily order block on the APE chart. If I get a good rejection I will be shorting APE.

APEUSDT Looks Bullish!APEUSDT Technical analysis update
Curently trading at $4.24
Buy zone: $4.21- $4.26
Stop loss : $3.99
Take profit 1 : $4.46
Take profit 2 : $4.73
Take profit 3 : $5.00
Always keep stop

APE Short setupShort position at the top range, we are currently at resistance. This was a multi month support turned resistance, and if we don't get a massive volue to breakout, this is just a retest that will end in a visitaion of the low zone and even further more. Max drawdown target shown in the image. Tight SL above resistance

APE BULLISH MOVE INCOMING🦧 #APE/USDT produced a cup & handle on 4h timeframe🧐
Send it to 5$ if we break out and confirm the pattern📈

APE longOn the 1D timeframe a downward wedge was formed on the coin. Since the beginning of December the price has been walking near the upper boundary of this wedge...
I think very soon we will break up!

APEUSDT SHORTHello my friends, today I want to talk to you about APEUSDT
Wait for good entry point #APE sure good FA coin

