Pinpointing Support and Resistance Zones for TradersLet's take a look at API3
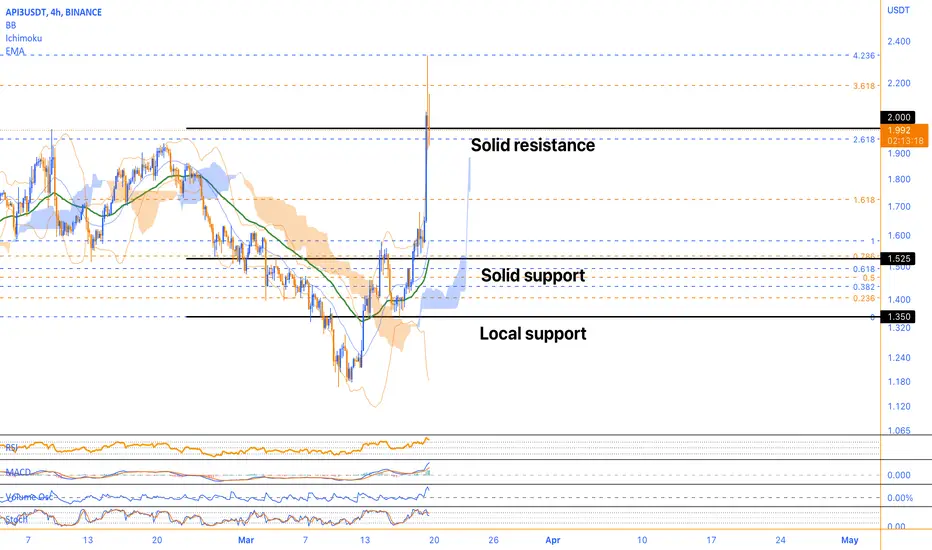
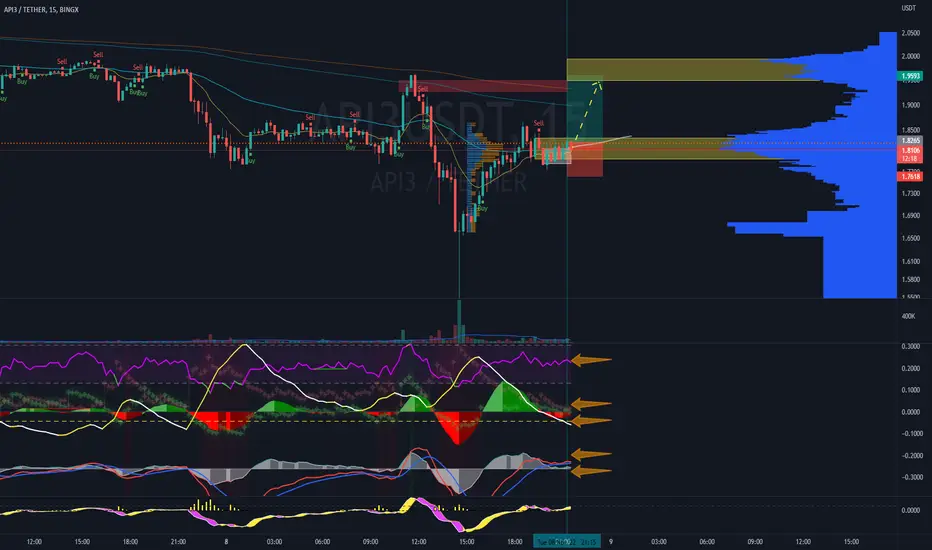
It is currently trading at $1.992, and the 4-hour timeframe is what we'll be analyzing here. There are a number of indicators to consider, so let's dive in and see what they're telling us.
First up, we have the Relative Strength Index (RSI) which is currently sitting at 83. This suggests that API3 is overbought at the moment, which could mean that there's a potential for a price correction in the near future. However, that's not the only thing to consider here.
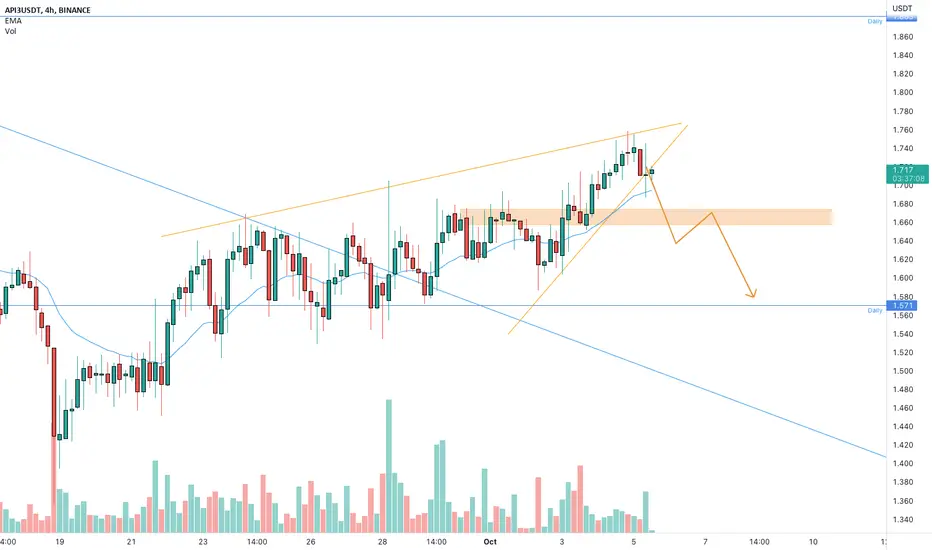
We also have the Fibonacci retracement levels to think about. The 0 Fibonacci level on the 4-hour timeframe is at 1.350, the 0.5 Fibonacci level is at 1.466, and the 1 Fibonacci level is at 1.580. Currently, API3 is trading above all these levels, which indicates a bullish sentiment. However, it also means that there may be resistance ahead if the price continues to rise toward these levels.
Next up, we have the Bollinger Bands. These bands consist of three lines: the upper, middle, and lower bands. At the moment, the upper band is at 2, the lower band is at 1.160, and the middle band is at 1.590. API3 is currently trading above the middle band, which is a good sign for bullish sentiment. However, if the price continues to rise and hits the upper band, it may indicate an overbought situation and could lead to a price correction.
Let's move on to the volume oscillator, which is currently at 43%. This indicates that there's moderate trading activity in API3 right now. So, while there may not be a ton of movement, there's still some activity to be aware of.
The Moving Average Convergence Divergence (MACD) is also worth looking at here. It's currently sitting at 0.138, which suggests that the bullish momentum is still present in API3.
The Stochastic Oscillators are currently at 73, indicating that API3 is overbought at the moment. This is something to keep in mind as it could mean that there's a potential for a price correction in the near future.
Finally, we have the 4-hour EMA 50, which is currently at 1.525. This is a good sign for bullish sentiment, as the current price of API3 is trading above the EMA. It suggests that the asset is currently in an uptrend.
So, what can we take away from all of this? Overall, it seems that API3 is experiencing some bullish momentum at the moment. However, the RSI, Fibonacci retracement levels, Stochastic Oscillators, and Bollinger Bands all indicate that the asset is overbought and may experience a price correction in the near future. Traders and investors should pay close attention to these indicators and monitor the price action around them to identify potential support and resistance levels.
API3USDT.PS trade ideas
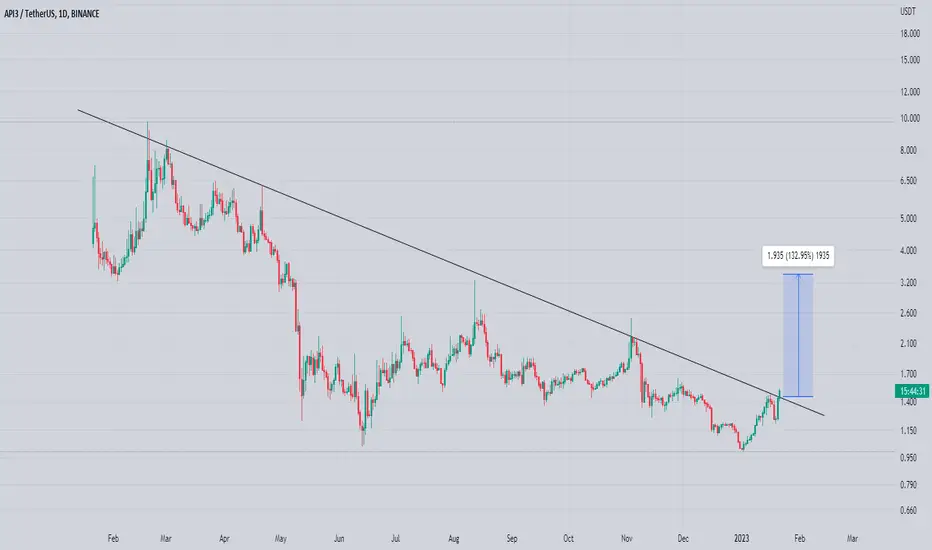
API3 Shall must go downThere is a downtrend on the instrument, a decrease in trading volumes, the buyer cannot update local highs, all this indicates the presence of its weakness.
In view of the above , a short breakout level was formed with several touches , as well as a downward slope - a descending triangle . I expect that the further inability to update the highs and the price tightening to the level of $ 1.390 will lead to its breakdown into the short.

API3: TRADE SETUP.API3/USDT
Entry: $1.48 to $CMP.
Stop loss: $1.417.
Target 1- $1.7.
Target 2- $1.81.
Target 3- $2.
Note: Do not trade without SL. Use 5x to 10x leverage.

Harmonic Crossing Roads 2BINANCE:API3USDT
Second Harmonic Crossing Roads!
Again Bullish Reversal but this time we have also libra pattern.
Our eyes on the price level of 1.60-1.63. With price action signal we can arrange a long position with a Stop Loss indeed.
Good Luck Everyone!

BTD...I believe this coin will do very well and is quite under the radar atm...As usual I'm early and ahead of the curve...moon it!
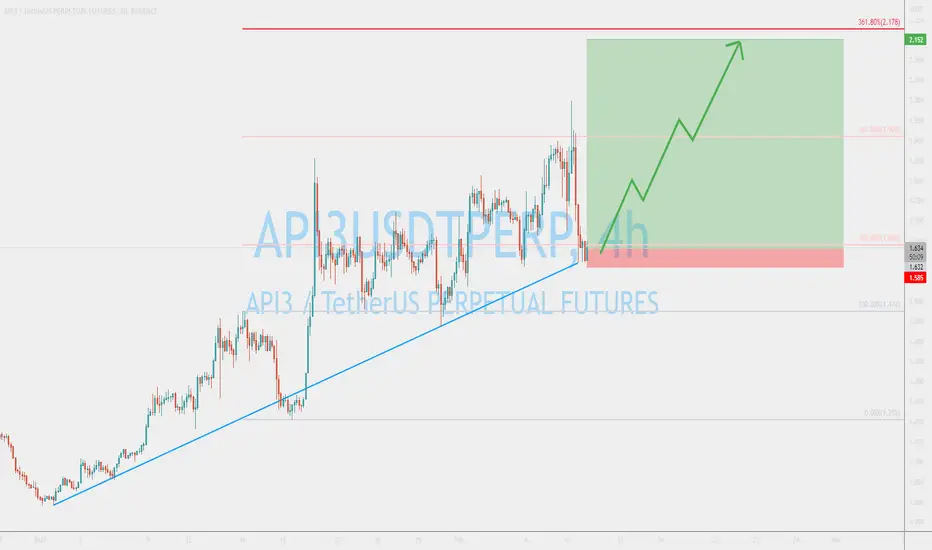
API3USDT perfect Risk/Reward opportunityWe can see a clear bounce off the trendline. As long as the price remains above the trendline, the uptrend will continue, providing an excellent RR trade setup.

$API3 - Long Scalp Opportuntiiy $API3 - Long Scalp Opportuntiiy
Entry Conditions:
- Holding inside consolidation range likely rise further
- Likely fill the weekly pivot on further retrace
- Break back above 200ema
- Likely fill the weekly pivot on further retrace
- Bullish Volume coming in
- Nice breakout on the RSI

API3USDT | DESCENDING TRIANGLE BROKENAPI3USDT has been trading with in a descending triangle .
The price has been converged.
Now the price has trading above the breakout of triangle and near the horizontal resistance zone.
The same zone is also a breakout zone.
The bulls need to hold the breakout zone.
Manage your trades accordingly.


Api3 breaking Major trend Line Breaking trendline In daily timeframe
once got cleared then We Can Expect 100 to 120% Bulish Wave
API3 - Is it about to plummet? In spite of API3 Token´s recent uptrend in the last couple of weeks (as in the whole crypto market), I´m still not convinced that the overall trend to the downside is over.
This is what we have:
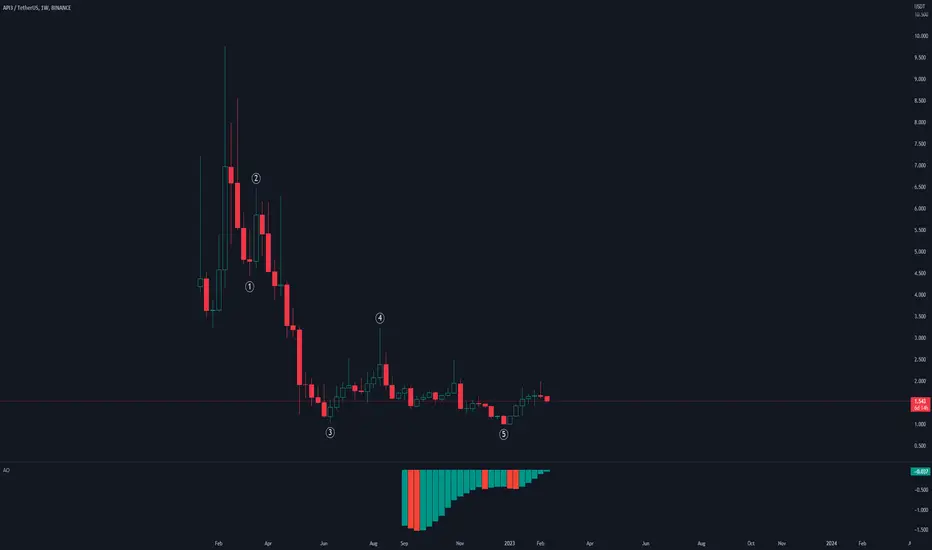
a. Valid leading diagonal for wave I
b. Valid impulsive wave III, in 5 sub-waves
c. Valid zigzag (blue ABC) correction for wave IV
d. Wave IV in the 50-61.8% pullback zone, and doesn´t overlap Wave I (pink invalidation line)
Therefore, at this moment, there is no reason for me to change the bearish bias.
Note that wave III was limited to 161.8% extension of waves I-II. This increases the possibility that wave V will be extended, giving targets in the .70 zone.

API3USDTHello Crypto Lovers,
Mars Signals team wishes you high profits.
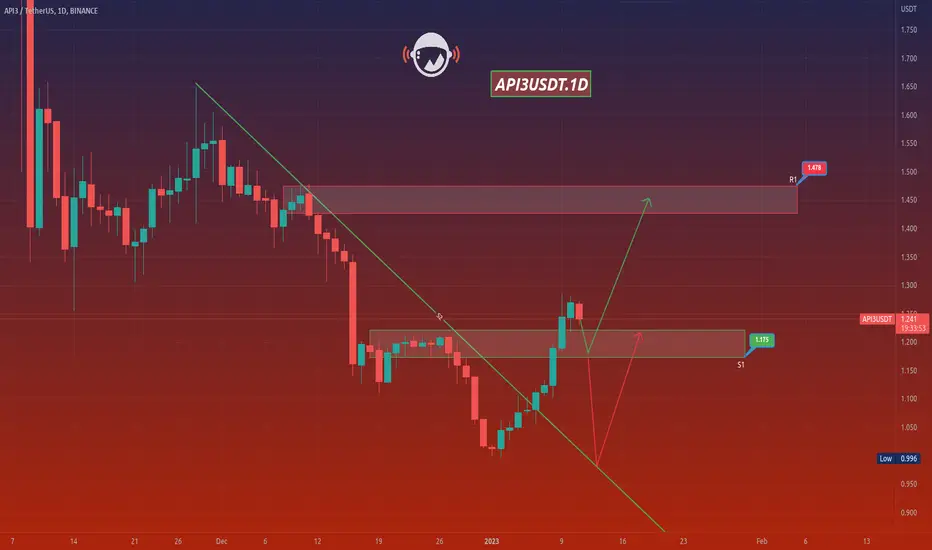
This is a one-day-time frame analysis for API3USDT
We see R1 as our resistance line in which the unsuccessful attempts of price to rise is clearly seen. S2 used to be a long-term resistance line. And S1 used to be another resistance area at the bottom of the chart. At the moment, the price is fluctuating over S1 and we believe it will fall to the bottom of this area and then by providing us some rising signs, there would be an increase expected for it toward R1. Even it is probable that the price is rejected at R1 and after a falling trend, again another rise happens to it to some higher amounts such as S1 or higher than that. We recommend you to obtain every piece of information and idea via our analyses for enjoying more profitable trades.
Warning: This is just a suggestion and we do not guarantee profits. We advise you to analyze the chart before opening any positions.
Wish you luck

API3USDT | SETUPAPI3 is at horizontal support where bulls once again can show some momentum, while having a double bottom too.
The price has broken above the falling trend line .
The break above falling trend line will give complete control to bulls. While break below double bottom will give strength to bears.
Trade your levels accordingly.

API3USDTSmart contracts often struggle to access dependable data, but application programming interfaces (APIs) have been touted as a solution to this problem.
API3’s stated goal is to allow decentralized versions of APIs to be built, managed and monetized at scales. As blockchain technology plays an ever bigger role in the economy — from decentralized finance to supply chain management — the team behind this project says it has never been more important for smart contracts to provide “timely, reliable real-world data.”

API3 token formed bullish Gartley for upto 165% pumpHi dear friends, hope you are well and welcome to the new trade setup of API3 token with BTC pair.
In the previous trade we had almost 41% pump, and the priceline was very close to hit the sell zone, but drpped down just before reaching the target as below:
Now on a 4-hr time frame, API3 is about to complete the final leg of a bullish Cypher pattern.
Note: Above idea is for educational purpose only. It is advised to diversify and strictly follow the stop loss, and don't get stuck with trade

API3USD LONGPossible upward movement of the pair. Price is currently in a lower bound trading zone with significant volume making stops and holding rejections at the bottom of the price near the 55 period EMA , essential in my strategy for analysis of potential trend continuations. Indicators like Squeeze Momentum and the MACD histogram have turned bullish after their red valley; accompanied by the loss of bearish strength indicated by the ADX rebounding towards the EMA . The MACD lines would be giving a possible buy signal soon. I think you could go looking for the previous high price zone when you see indications of a bounce move higher on the 4-hour chart. In 1 hour timeframes we see that it has broken the bearish structure, forming higher lows than the previous ones.
If you are going to take my opinion into account, please respect the projection time, this is extremely important. If it is not fulfilled in the foreseen time and makes a range, it will be better to close the operation in case it is possible.

API3USDT is creating a rising wedgeThe price is creating a rising wedge on the 4h timeframe and now the price is trying to hold the trendline
How to approach it?
IF thee price is going to lose the 4h support and retest it as new resistance, According to Plancton's strategy , we can set a nice order
–––––
Keep in mind.
🟣 Purple structure -> Monthly structure.
🔴 Red structure -> Weekly structure.
🔵 Blue structure -> Daily structure.
🟡 Yellow structure -> 4h structure.
⚫️ black structure -> <= 1h structure.
–––––
Follow the Shrimp 🦐

API3 BUY THE BREAKOUT 20221002Buy when breaking through the resistance
API3, API3USD , API3USDT , API3USDTPERP , API3BUSDPERP, CRYPTO, CRYPTOCURRENCY
DISCLAIMER
This is only a personal opinion and does NOT serve as investing NOR trading advice.
Please make your own decisions and be responsible for your own investing and trading Activities.

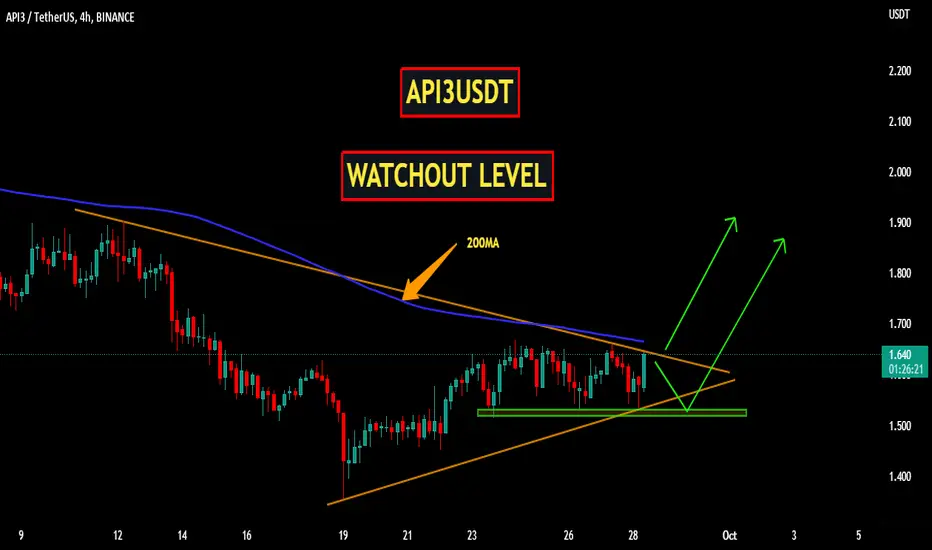
API3USDT | WATCHOUT LEVELAPI3USDT has been trading under the falling resistance. The price has hold an important horizontal support and bulls show strong momentum at support zone . The bulls took control from support zone . The rising support has been respected by price.
One can wait for breakout and can enter on confirmation .
Manage your levels accordingly.