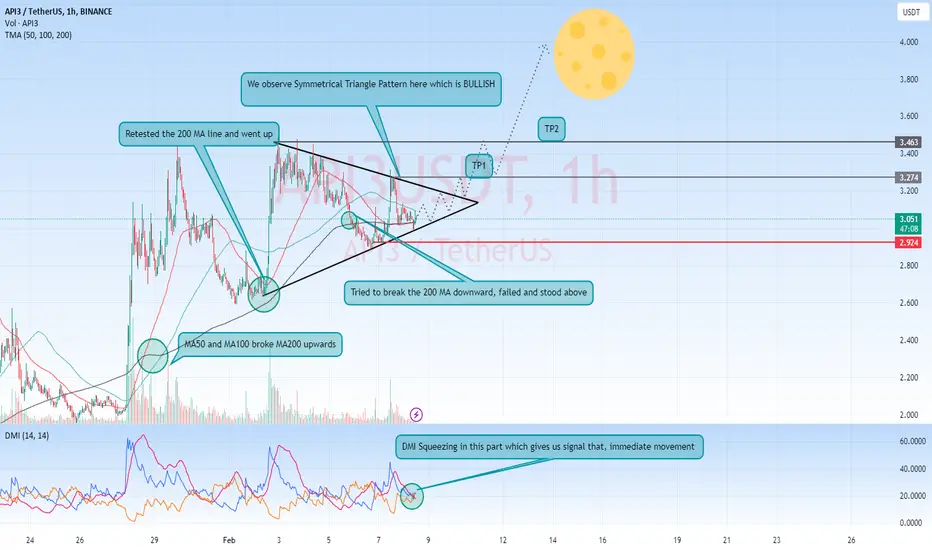
Destiny Within an hour, the triangle pattern is broken from above and is expected to grow to the size of the growth inside the triangle, in the range of 120 to 130 percent.
API3USDT trade ideas

Destiny Quite clearly, the harmonic pattern of the cup and handle is forming, and if we pay attention to the main resistance and the weekly resistance base, it is located in the current range and with the failure of this resistance it will advance to the range of $10, and then it will correct to form the cup handle

Api3 New HighCan we get a straight forth leg correct?(maybe not) but if it holds here it can go to 6.
Took some risk on longs api3 from below 4.08.
Stoploss at 4.
Note: Not a Financial Advice

API3USDT.PAPI3USDT.P is in bearish trend.
Potentially printing LH and LL .
Sellers are strongly active .
WE sell at CMP>

Buy signalA great scalp position, given that we are in a strong uptrend and corrective wave analysis we can expect to return to the green zone.
Be patient and enjoy your profit

Buy signalA great scalp position, given that we are in a strong uptrend and corrective wave analysis we can expect to return to the green zone.
Be patient and enjoy your profit
API3USD 📈 Long IdeaAPI3 gained the powerful momentum and the price going inside the increasing channel. When it breaks the triangle, the possibility of going higher to the 4.50 USD point is inevitable.
If the price goes down the lower trend line and retests successfully, the it will go down to the previous support level at least.
Lets see what happens, good luck for all! 🙌🏽❤📈
#crytp #btc #analysis #api3 #usd

API3USDTmy entry on this trade idea is taken from a point of interest below an inducement .. I extended my stoploss area to cover for the whole swing as price can target the liquidity there before going as i anticipate.. its just a trade idea, not financial advise

API3 might go for the next HighApi3 can go for next high from here.
Longed some here at under 2.64
Stopping if hold below 2.6.
Targeting 4.3 area.
Note: Not a Financial Advice.

API3USDTmy entry on this trade idea is taken from a point of interest below an inducement .. I extended my stoploss area to cover for the whole swing as price can target the liquidity there before going as i anticipate.. its just a trade idea, not financial advise

API3/USDTBINANCE:API3USDT.P
This idea has a medium-term profit target.
All targets are indicated on the graph.
- Risk 1% on deposit
- R/R 1/2
P.S (This is not an investment recommendation, this is my personal opinion.)

Accumulation before the level, free zone after the levelAccumulation before the level, free zone after the level
API3 can 1400% in 2024, time to buy?API3 is breaking out of the falling wedge pattern on the weekly chart, which is a great sign of strength. We can see that the corrective Elliott Wave pattern WXYXZ is complete, and we are starting a brand new uptrend to an all-time high. I believe 2024 will be very bullish for this coin, so it is better to buy now when the price is still cheap. We must also look at the volume indicator. We can see that the bullish volume is much higher than the bearish volume, which gives us confidence in this trade. Let me know what you think about my analysis, and please hit boost and follow for more ideas. Trading is not hard if you have a good coach! Thank you, and I wish you successful trades.
What Is API3 (API3)?
Smart contracts often struggle to access dependable data, but application programming interfaces (APIs) have been touted as a solution to this problem.
API3’s stated goal is to allow decentralized versions of APIs to be built, managed and monetized at scales. As blockchain technology plays an ever bigger role in the economy — from decentralized finance to supply chain management — the team behind this project says it has never been more important for smart contracts to provide “timely, reliable real-world data.”
The whitepaper for API3 was unveiled in September 2020 and set out the main problem that’s associated with APIs at present: connectivity. At present, there’s no way for smart contracts to establish a direct connection with APIs for the latest data — and this has led to an explosion in the popularity of oracles.
Although this has helped solve the problem to some extent, the industry has since been grappling with the “Blockchain Oracle Problem.” Oracles are a form of middleware that sit in between APIs and smart contracts — increasing costs and centralization. API3 intends to get around this problem by enabling API providers to operate their very own nodes.
API3’s token went live at the start of December following on from a token sale that generated tens of millions of dollars.
Let me know what you think about my analysis, and please hit boost and follow for more ideas. Trading is not hard if you have a good coach! Thank you, and I wish you successful trades.

API3 - 1D - $8,50 - 85% profit possibleAPI3 has no more resistance levels left on shorter time frames so the price could now potentially increase to $8,50 which is approx a profit of 85% the coming days.

API3/USDT Break Alert!! Bullish Momentum for API3 continue UP!💎 API3 has recently experienced significant market dynamics. Currently, API3 has successfully broken out of a key resistance area, indicating a potential shift in momentum.
💎 The price is now undergoing a retesting phase, revisiting the previous resistance, which is now acting as support. If this retesting phase holds, we may witness a bounce from the support level, probability of the price further upward toward our target supply area.
💎 However, if API3 fails to bounce during the retesting phase and instead breaks down below the support level, it could signify a false breakout. In such a scenario, the price may revert to a downward trajectory, returning to the demand area around 2.05.
💎 At the demand area, it is crucial for API3 to exhibit a bounce and reclaim the key resistance area to resume its upward momentum. Failure to do so may result in continued downward movement, potentially leading the price back to test the strong resistance area once again.

API3USDT Long Idea 📈Here is my CRYPTO idea for the coin that I hold in my margin trade balance. All the points are elaborated on the graph. Good luck for all!
Boost If you liked 🙌🏽❤
Destiny The picture is quite expressive and clear and I hope you understand that you should not buy when there is resistance in the daily frame, I predict a drop to the level of $2.

Destiny It is quite clear that each time the price growth is less and less and the price growth distance is also less and less, according to the previous analysis, I expect it to fall to the $2 range.

DestinyThe totality of the trend if we observe that it has reached the important Fibo retracement range of 0.618 and I expect a fall to the 0.382 area, in the hourly time frames have also already analyzed if there should be a price drop

API3/USDT - API3: Trend Reversal◳◱ On the $API3/ CRYPTOCAP:USDT chart, the Trend Reversal pattern suggests indications that the trend may be gaining or losing strength. Traders might observe resistance around 3.562 | 3.973 | 4.87 and support near 2.665 | 2.179 | 1.282. Entering trades at 3.171 could be strategic, aiming for the next resistance level.
◰◲ General info :
▣ Name: API3
▣ Rank: 173
▣ Exchanges: Binance, Kucoin, Bybit, Huobipro, Gateio, Mexc
▣ Category/Sector: Services - Data Management
▣ Overview: API3 is a collaborative project to deliver traditional API services to smart contract platforms in a decentralized and trust-minimized way. It is governed by a decentralized autonomous organization (DAO), namely the API3 DAO. Therefore, API3's code is open source and its operations are transparent.
◰◲ Technical Metrics :
▣ Mrkt Price: 3.171 ₮
▣ 24HVol: 10,668,767.956 ₮
▣ 24H Chng: 3.865%
▣ 7-Days Chng: -3.82%
▣ 1-Month Chng: 88.44%
▣ 3-Months Chng: 102.08%
◲◰ Pivot Points - Levels :
◥ Resistance: 3.562 | 3.973 | 4.87
◢ Support: 2.665 | 2.179 | 1.282
◱◳ Indicators recommendation :
▣ Oscillators: BUY
▣ Moving Averages: STRONG_BUY
◰◲ Technical Indicators Summary : STRONG_BUY
◲◰ Sharpe Ratios :
▣ Last 30D: 3.51
▣ Last 90D: 2.10
▣ Last 1-Y: 0.96
▣ Last 3-Y: 0.57
◲◰ Volatility :
▣ Last 30D: 2.86
▣ Last 90D: 1.84
▣ Last 1-Y: 1.35
▣ Last 3-Y: 1.49
◳◰ Market Sentiment Index :
▣ News sentiment score is N/A
▣ Twitter sentiment score is N/A
▣ Reddit sentiment score is 0.59 - Bullish
▣ In-depth API3USDT technical analysis on Tradingview TA page
▣ What do you think of this analysis? Share your insights and let's discuss in the comments below. Your like, follow and support would be greatly appreciated!
◲ Disclaimer
Please note that the information and publications provided are for informational purposes only and should not be construed as financial, investment, trading, or any other type of advice or recommendation. We encourage you to conduct your own research and consult with a qualified professional before making any financial decisions. The use of the information provided is solely at your own risk.
▣ Welcome to the home of charting big: TradingView
Benefit from a ton of financial analysis features, instruments and data. Have a look around, and if you do choose to go with an upgraded plan, you'll get up to $30.
Discover it here - affiliate link -

DestinyDue to the price pivots and the paradox with the volume pivots and the lower indicator of the image, negative reactivity can easily be seen, as well as the breaking of the support trend of the floor, the other thing is that you are caught in a price suffering box that I hope you will not be fooled, according to all interpretations, I expect the price to reach the $2 price range.

#API3 #API3USDT #Short #ShortSetup #Eddy#API3 #API3USDT #Short #ShortSetup #Eddy
Its my "API3/USDT" short setup <3
Enjoy Guys ;-)

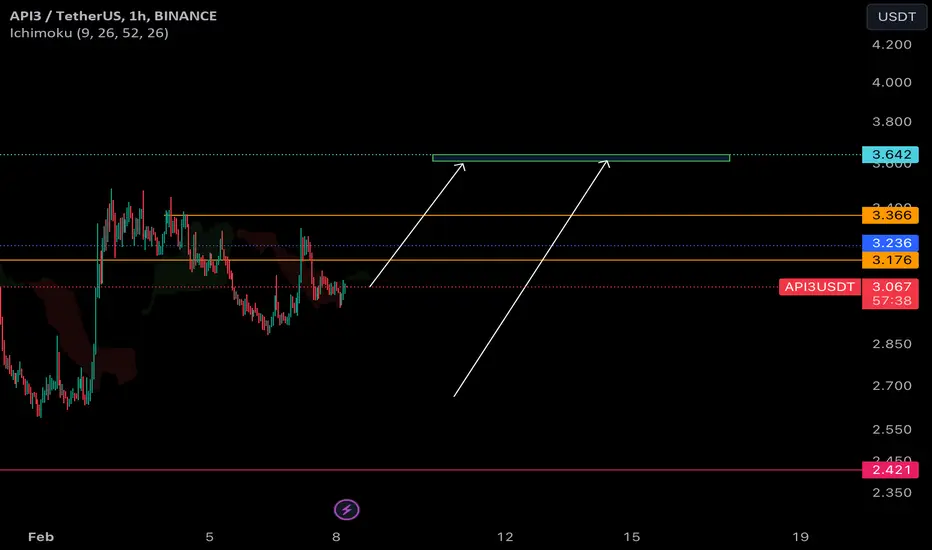
#API3 Forming ascending triangle pattern!#API3 BINANCE:API3USDT is forming an ascending triangle. it has support of MA 50, trendline, and the Ichimoku cloud support.
A solid breakout of the triangle would be the bullish confirmation, while a rejection would be a sign of further movement inside the triangle.
Entry Point: CMP and add more up to $3
Targets: $3.6, $4, $4.5,$4.7,$5.5,$6.9 estimated profits of 120%.
Stop Loss (SL): Set at $2.86 manage risk effectively.
It's crucial to have a stop loss in place to manage risk. Always be cautious and consider risk management strategies.
#DYOR
