APTUSDPair : APTUSD ( Aptos / U.S Dollar )
Description :
Bearish Channel as an Corrective Pattern in Short Time Frame
CHoCH
Demand Zone
Completed " 12345 " Impulsive Waves and " AB " Corrective Waves
Break of Structure
APTPERP trade ideas

Bullish Medium TermI am not a financial advisor. This is not meant to be and does not constitute financial, investment, trading, or any other types of advice or recommendation.

Short APT New Trade StrategyPrice deviation at the top of the range looks like it is breaking down diagonal trend line cross target below im wrong if price puts in a higher high here.
It may sweep the highs so i will set alert to make sure i dont get stoped out.

APTOS #APT Massive falling wedge breakoutLooking for Aptos to have a powerful 2024
and looking to capture ATH's
Looking at price projections $25 (regular) - $35 (logarithmic) to be met

APTOS to $15Sorry I didn't bring it to your attention sooner
BUT nice breakout and retest of the neckline
I expect the Log target to be met with GUSTO!

Long AptosAptos has suffered during the last couple of weeks making the price especially attractive here. Additionally, we are nearing a good area of support both price-wise and on our RSI. An entry here at 11.87 with a target of 18.00 and a SL of 9.87 puts our RRR over 3 to 1. I like these odds.

APT retesting the break out A breakout occurs when the price of an asset moves above or below a significant level of resistance or support respectively. In this case, let's say APTUSD experienced a breakout above the $17 mark. This signifies a potential shift in market sentiment where buyers have gained control and are willing to pay more for the asset, pushing its price above the previous resistance level.
Retest: After a breakout, it's common for the price to retrace back to the breakout point to test its newfound support or resistance level. In the context of APTUSD breaking above $17, a retest would involve the price falling back to around $17. During this phase, traders and investors observe whether the previous resistance (now turned support) holds. If the support holds, it reinforces confidence in the breakout.
RSI is also supporting retest-to the moon theory

APTUSD to 90$
Based on technical analysis indicating a potential cup and handle formation in the APTUSD chart, there's a compelling expectation for the price to surge from its current level of $18 to $90. The cup and handle pattern typically signifies a bullish continuation, with the gradual upward movement forming the cup followed by a temporary consolidation or retracement forming the handle. As the price breaks out above the resistance level formed by the peak of the cup, it often triggers renewed buying pressure, propelling the asset towards higher price targets. If APTUSD follows this pattern, investors could anticipate a significant uptrend, with $90 being a plausible target for the continuation of the upward momentum. However, it's essential to exercise caution and consider other factors alongside technical analysis when making investment decisions, as market movements can be influenced by various factors beyond chart patterns.

APT/USDTAptos to the moon, this thing is gonna yeet brev! Becos the APT/BTC has been looking juicy for some time now. Look at da price, look at volume, look at da strength on all these beetcoyn dips!

Ascending Triangle for APTAPTOS has held up better than most mid cap coins during todays BTC sell off.
Using a conservative entry on the ascending triangle pattern we can maximize R/R for this trade by entering off the rising trend. Not at the top of the range which is higher risk.
Be sure to watch the MACD for more dark green histogram hints. Light green or red prints can indicate weakness.

$APT on its way to price discoverythanks to a call out by @EXCAVO I started following this token over the last week, which happened to have its largest volume of its life time in just the last week alone.
looking for a retrace here, then a build back up.
daily is volume breaking 20m

APT Long - Broke out of descending wedge & previous resistanceCOINBASE:APTUSD broke above the downward trend line to break out of the bullish wedge / pennant pattern. Also broke to new highs above previous resistance. Price broke above period 250MA.
2 weeks ago they released $250m of locked coins. This barely impacted price.
Looking for a 2:1 risk to reward, based on the height of the wedge. Stops below previous major swing low.

Aptos APT Big DirectionAptos is a strong project but with hidden motives.
We are in a very long acummulation phase for the next big move.
There are 2 scenarios that I look to:
1) We settle the ground between 8.5$ and 10$ and go to a new ATH, slowly.
2) We revisit the lower Line I have drawn around 5.7~6$ for a quick retest and go for 34$+.
My plan is to go very big on purchasing once APT touches 6$, since I already have a good amount bought at 9.7$ and Hold long term.

Longing Aptos to $11I’ve got another trade for you all here in Aptos. Nearly all of my signals are flashing green on APT. I can’t sit the sidelines waiting on Bitcoin here. I’m in at $9.50. Targeting $11+. SL is $8.73 (just under the VRVP PoC) for a 2/1 rrr.

APTLooks like APT is starting to move higher after pulling back to support at first quarter retracement of the whole move.
Also, retesting meme diagonal resistance as support.
If can continue closing above 9, a swift move. up to 13 (mid of the whole move) seems imminent.

Quick thoughts on $APTSUI had a nice run, price discovery. While Aptos at 1/2 of ATHs.
SUI also jumped over Aptos in terms of FDV 15b vs Aptos 9.7b.
Aptos had big involvements with FTX maybe that's why sellpressure and underperformance.
In terms of chart:
- ATH - Low --> FIB
1. beautiful retracement to 0.25.
2. bounce to 0.618 got rejected
3. tested 0.5 as support
4. now decision time.
Bull case:
IF this is a big bull flag forming, and breaks out to upside, then target ATHs;
Low time frame: potential head and shoulders, if plays out we revisit bottom of the channel.
IF we go downside, 7.8 - 8$ is where i would start buying.

APTOS BREAKS KEY WEEKLY RESISTANCEA few weeks ago, I shared key weekly levels on a number of tokens that I have been watching. Some of the newer tokens continue to show strength, uninhibited by traders that have been underwater for years and are looking to sell.
As you can see, Aptos finally broke and close above the key resistance at $9.44, after failing with wicks above for many weeks. Conservative traders will wait for a retest of that level, knowing it may never come.
The next target is $13.09. If that hits, we reevaluate.

Aptos following same pattern as SuiExpecting a huge move for apt , new coin without a lot of bagholders from previous runs

APTUSD - Bullish IdeaAn idea for APTUSD comparing a previous bullrun to the one that is emerging now
A lower low can be seen in both situations leading to the bull run, this is shown in the white box and the green dotted line.
I do not have a price target but it should surpass the previous ATH.

Aptos ($APT) Spectacular Growth of 200% for the Last Month
Aptos also recently hit a new high by testing the $10.95 mark. The asset has grown 200% over the last 2.5 months. Observing AMEX:APT chart reveals a notable level of correlation. This is due to both cryptocurrency networks being built on the Move programming language and sharing similar audiences.
AMEX:APT 's continued growth is the most likely outcome. In this scenario, APT might break through the $10.55-$10.95 resistance zone and test a new high, potentially at $11.5.
In the event of a correction, Aptos could retest the buyer's level at $9.25 and might also test the support zone of $8.5-$8.9. The upward trend for the asset is expected to persist as long as BTC maintains trading above the critical and psychological zone of $40,000.

APT/usdt longT1= 14 $
An inverse head and shoulders is similar to the standard head and shoulders pattern, but inverted.
It may be used to predict reversals in downtrends.
An inverse head and shoulders pattern, upon completion, signals a bull market.
Investors typically enter into a long position when the price rises above the resistance of the neckline.

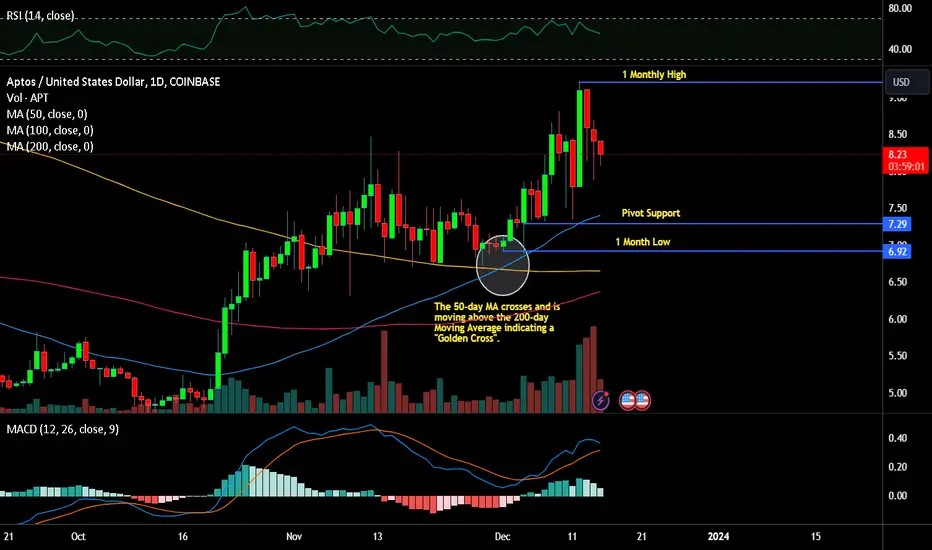
Aptos ($APT) Continues Growth
APT continues to exhibit positive growth. It increased by 32% in December 2023, reaching a local high of $9.2. Currently, the coin is trading in a sideways range, with support at $8.00 and resistance at $8.75-$9.20.
If BTC maintains above $40,000, APT's growth is likely to persist. The next major target for buyers would be the psychologically significant $10 mark. Beyond this point, APT's growth could accelerate, considering its prolonged absence from these price levels, potentially rendering current resistance levels obsolete.
In a downturn scenario, APT might fall to the $7.30-$7.62 range or even test the $7 level. It's important to note that private APT investors recently unlocked a significant number of coins bought at $2-$3. Consequently, any correction in the Aptos market could exert downward pressure on its price due to the increased supply.