Aptos, Good & Bad (Leveraged Trading vs Spot)This is both good and bad at the same time.
The bad part, or rather sad part, is the fact that there hasn't been any decent bullish action recently. This pair did not grow by any significant amount after its 7-April low.
Ok, what about the good part?
The good part is that prices are low. This pai
APT/USDT: Bullish Technical OutlookAPT/USDT: Bullish Technical Outlook
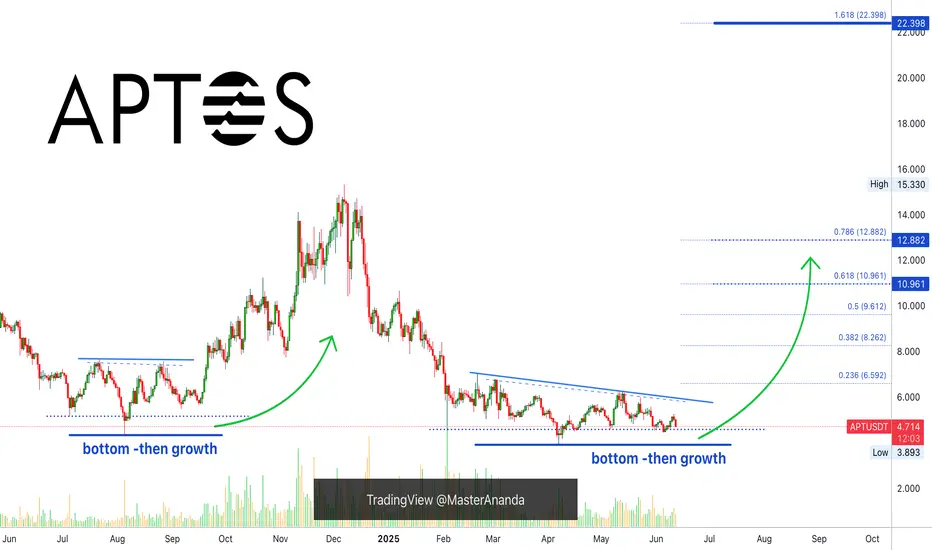
APT has completed a broader and well-defined bullish pattern, suggesting an upward trajectory in the coming days and possibly weeks. The continuation of this move will largely depend on market volume.
Under normal conditions, I'm anticipating a price move towar

#APT/USDT#APT
The price is moving within a descending channel on the 1-hour frame, adhering well to it, and is heading towards a strong breakout and retest.
We are experiencing a rebound from the lower boundary of the descending channel, which is support at 4.87.
We are experiencing a downtrend on the RSI

APTUSDT 1D AnalysisAPT ~ 1D Analysis
#APT Buy back gradually from here if you still have confidence in this coin with a short term target of at least 15%+ and a long term target of $15

it's time to going up for APTUSDT!!!!!before buying, please check for being sure about your opinion about this CRYPTOCURRENCY!!!
(in every target you want, closed the position but our target is the third one)
*Guy's the entry place is importance things in enter in a position and be careful do not going up your leverage over 7x ,all th


TradeCityPro | APT: Triangle Squeeze Near Crucial Support Zone👋 Welcome to TradeCity Pro!
In this analysis, I’ll be reviewing the APT coin. The Aptos project is one of Ethereum’s Layer 2 solutions.
✔️ This project’s token currently holds a market cap of $3.1 billion and ranks 32nd on CoinMarketCap.
📅 Daily Timeframe
On the daily chart, you can see a very str

APTOS $APTI don't think I need to explain what APTOS is here.
Right now, it's a good point for a swing position, which is why you're seeing this post.
Best regards EXCAVO

Aptus Apt usdt Daily analysis
Time frame daily
Risk rewards ratio >2 👈👌
Target 7.4$
Pattern = two bottom

APTUSDTThe specified range is important, and if the upward trend is maintained, market sentiment remains positive, liquidity enters, and we see good momentum from this currency in the above timeframe, we can consider the specified scenario probable.

See all ideas
Summarizing what the indicators are suggesting.
Oscillators
Neutral
SellBuy
Strong sellStrong buy
Strong sellSellNeutralBuyStrong buy
Oscillators
Neutral
SellBuy
Strong sellStrong buy
Strong sellSellNeutralBuyStrong buy
Summary
Neutral
SellBuy
Strong sellStrong buy
Strong sellSellNeutralBuyStrong buy
Summary
Neutral
SellBuy
Strong sellStrong buy
Strong sellSellNeutralBuyStrong buy
Summary
Neutral
SellBuy
Strong sellStrong buy
Strong sellSellNeutralBuyStrong buy
Moving Averages
Neutral
SellBuy
Strong sellStrong buy
Strong sellSellNeutralBuyStrong buy
Moving Averages
Neutral
SellBuy
Strong sellStrong buy
Strong sellSellNeutralBuyStrong buy
Displays a symbol's price movements over previous years to identify recurring trends.
Related pairs
Frequently Asked Questions
The current price of APTOS / USD TETHER (APT) is 4.641 USDT — it has risen 1.59% in the past 24 hours. Try placing this info into the context by checking out what coins are also gaining and losing at the moment and seeing APT price chart.
APTOS / USD TETHER price has fallen by −4.69% over the last week, its month performance shows a −14.77% decrease, and as for the last year, APTOS / USD TETHER has decreased by −41.22%. See more dynamics on APT price chart.
Keep track of coins' changes with our Crypto Coins Heatmap.
Keep track of coins' changes with our Crypto Coins Heatmap.
APTOS / USD TETHER (APT) reached its highest price on Jan 26, 2023 — it amounted to 20.400 USDT. Find more insights on the APT price chart.
See the list of crypto gainers and choose what best fits your strategy.
See the list of crypto gainers and choose what best fits your strategy.
APTOS / USD TETHER (APT) reached the lowest price of 3.066 USDT on Dec 29, 2022. View more APTOS / USD TETHER dynamics on the price chart.
See the list of crypto losers to find unexpected opportunities.
See the list of crypto losers to find unexpected opportunities.
The safest choice when buying APT is to go to a well-known crypto exchange. Some of the popular names are Binance, Coinbase, Kraken. But you'll have to find a reliable broker and create an account first. You can trade APT right from TradingView charts — just choose a broker and connect to your account.
Crypto markets are famous for their volatility, so one should study all the available stats before adding crypto assets to their portfolio. Very often it's technical analysis that comes in handy. We prepared technical ratings for APTOS / USD TETHER (APT): today its technical analysis shows the sell signal, and according to the 1 week rating APT shows the sell signal. And you'd better dig deeper and study 1 month rating too — it's sell. Find inspiration in APTOS / USD TETHER trading ideas and keep track of what's moving crypto markets with our crypto news feed.
APTOS / USD TETHER (APT) is just as reliable as any other crypto asset — this corner of the world market is highly volatile. Today, for instance, APTOS / USD TETHER is estimated as 4.16% volatile. The only thing it means is that you must prepare and examine all available information before making a decision. And if you're not sure about APTOS / USD TETHER, you can find more inspiration in our curated watchlists.
You can discuss APTOS / USD TETHER (APT) with other users in our public chats, Minds or in the comments to Ideas.