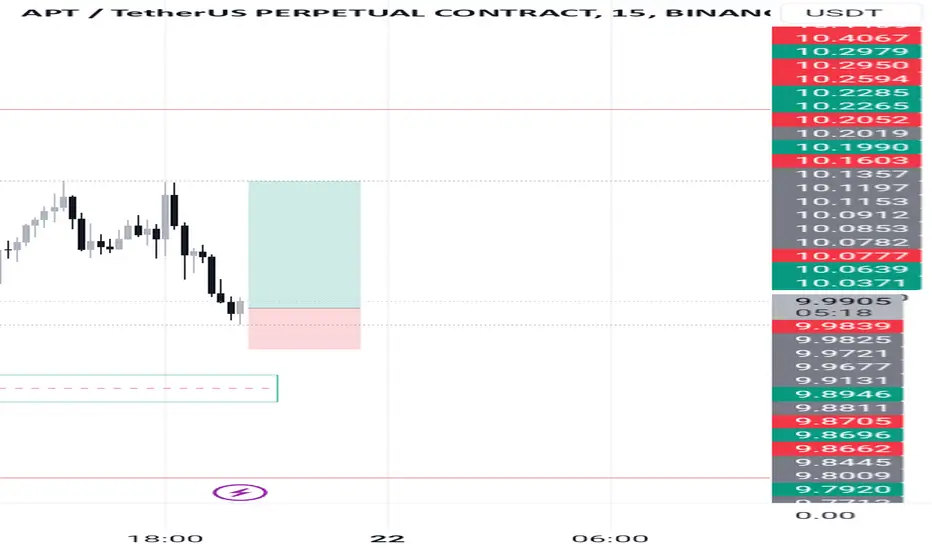
APT USDT- MUST WATCH THIS ANALYSISIf price rejects from the FVG, Then we can watch the below support level and the imbalance of the market, And RSI shows bearish divergence.
APTUSDT trade ideas

Aptos | APT vs SUIThe price of Aptos is $10.7 today with a 24hour trading volume of 128 million dollar. This represents a 7% price increase in the last 24 hours and a 6% price increase in the past 7 days
With a circulating supply of 190 Million APT, and YES we back to 2 billion dollar Marketcap. now lets compare SUI and APTOS
Both Aptos and Sui blockchains are designed to address the scalability and efficiency issues faced by the current generation of blockchain networks. They both implement one of the most advanced programming languages – Move, utilize parallel execution for high throughput, and offer low latency. These similarities make them attractive options for businesses looking to build blockchain-based applications. The language used for parallel execution in both Aptos and Sui is Move, which is based on Rust and was initially designed at Meta. The language offers powerful tools and features to build smart contracts and decentralized applications. However, Sui has its own version of the language.
Aptos follows the standard design outlined in Diem’s whitepaper, while Sui has a slightly different object model. Sui’s storage system is object-centric, which means that most things on the blockchain, including addresses and transactions, are represented as objects.Sui’s version of Move clearly indicates when an object is owned, shared, mutable, or immutable, whereas Aptos does not. Additionally, Sui’s ownership API is cleaner than Aptos’s, as it provides a clearer representation of the blockchain design
Sui and Aptos differ significantly in their architecture, particularly in how they utilize distributed ledger technology. Sui’s ledger is stored as a directed a cyclic graph rather than a blockchain like Aptos. While both designs are efficient and share similarities with traditional blockchains, their differences are essential to their consensus mechanism and scalability.aptos has a modular architecture that enables easy upgrades and customizations, while Sui focuses on a multi-layered architecture to separate the consensus, storage, and computation layers. This allows for improved scalability and flexibility in the network.The ecosystems are very different and extensive in both projects. Every day there is something new to discover at both chains. It’s hard to pick out an outsider and a favorite. Aptos blockchain got its popularity before Sui, but at the moment, judging by the number of followers on Discord, Sui is overtaking Aptos.
After a surge in the popularity of Aptos several months ago, many various projects were created and launched exactly using that blockchain. During the year 2022, over 100 projects were developed using Aptos network.the most popular projects built over Aptos include Pontem (a universal wallet) and Pyth (a modern oracle). Aptos boasts a growing ecosystem of tools, libraries, and developer resources, while Sui’s ecosystem is relatively nascent but has the potential to grow rapidly as more developers join the network.as for Sui, the mainnet of the network will only be launched in Q2 2023 and the testnet was launched in the last days of March 2023. Thus, the majority of the project is now TBA. One of the most remarkable Sui projects so far is Sui wallet. Still, the Sui blockchain has great potential to overtake Aptos due to its scalability level.
Aptos and Sui are two blockchain ecosystems with different approaches to their tokenomics. Aptos has released an overview of their tokenomics for their native token APT, but additional information is expected to be published soon. APT is currently used for PoS participation and liquidity incentives, with an initial supply of 1 billion tokens. The majority of the initial supply is currently staked for PoS participation, with the remaining tokens allocated to different categories.
On the other hand, Mysten Labs has published an in-depth whitepaper on the native token of Sui, SUI. SUI will be staked within an epoch to participate in the proof-of-stake mechanism and on-chain voting. Additionally, SUI will be used as the asset denomination to pay for gas fees and other operations on the Sui platform, with a total supply of 10 billion tokens. The exact allocation percentages for the distribution of tokens have not been released, but the presence of the storage fund can create monetary dynamics and reduce the amount of SUI in circulation.
In conclusion, both Aptos and Sui have their unique selling points and hold great potential for businesses looking to adopt blockchain technology. However, Sui and Aptos are rapidly developing ecosystems, they’re still pretty ‘young’ compared to other big players in the industry. Thus, they are definitely expected to settle all security audit issues soon.

#APT\USDT#APT
The price is moving in a descending channel on the 1-hour frame upwards and is expected to continue.
We have a trend to stabilize above the moving average 100 again.
We have a downtrend on the RSI indicator that supports the rise by breaking it upwards.
We have a support area at the lower limit of the channel at a price of 9.70.
Entry price 9.80.
First target 10.19.
Second target 10.50.
Third target 10.88.

APTUSDT-LONG IDEAAPTUSDT is in bullish trend expect to buy at 0.5 fib level retracement as it is making continuous higher highs and higher lows buy at the given point rest of the things are mentioned in the chart.

APTOS LOOKS WEAKAptos is at a very crucial level and based on how BTC loooks, I would expect a quick move to the downside before continuation up.
Calculate Your Risk/Reward so you don't lose more than 1% of your account per trade.
Every day the charts provide new information. You have to adjust or get REKT.
Love it or hate it, hit that thumbs up and share your thoughts below!
This is not financial advice. This is for educational purposes only.

APTOS - SHORTAPTOS - SHORT
TP - expect a bounce after the TP
Let see - not financial advice -
even expect to 8.85 or so

day 72i have backtested and journaled for 72 days and i had great results but i was not good enough to be able to withdrawl and i want to continue to backtest till i reach to 100 days of backtested days and then i will open a samll live account and if i achive my 10 percent monthly gola i will go for a prop account

APTOS - APT - broke level and currently finding support Chart Request on today's show
#APT broke resistance 9.6620
then retested the level.
There might be a pullback
Recommended 50% at current price
then add to entry after price breaks
newly created resistance ( not created yet )
Market Cap 5.3B
Staking / Layer 1
Not Financial Advise - Entertainment Purpose Only
Always DYOR ( do your own research )


APT with bullish Market StructureAPT currently with bullish market structure , breaking levels and may continue the upward momentum .
This was covered today per one of the viewers
Not Financial Advise - Entertainment Only

APTUSDT: Inverse Head and Shoulders Pattern FormationAPTUSDT technical analysis update
APT has formed an inverse head and shoulders pattern on the daily chart. The price has broken the neckline and is now retesting it as support. Additionally, the price is trading above the 100 and 200 EMAs on the daily chart. A strong bullish move is expected in the coming days.
Regards
Hexa

APTUSDT Surges Above 100 and 200 EMAAPTUSDT technical analysis update
APT's price has crossed above the 100 and 200 EMA on the daily chart. It has now retested the 200 EMA and is bouncing back, having also broken through a major resistance zone. We can expect a strong bullish move in the coming days.
Regards
Hexa


APTUSDT-LONG IDEAAPTUSDT is continuously making higher high and higher low and there is a strong possibility of market going up. put buy stop order on the given point rest of the remaining things are mentioned in the chart. do your own analysis before taking the trade.

APT Tradethis is the trade I ended up taking and got a nice long wick reaction and targeted a nice 1:2.5R
to the last bit of liquidity and hopefully we can hit take profit before the price reverses towards the upside and if not that's fine, losing trades always teach you something and you should make the most of it. the mid line is the fair price and price could react to that as well.
best of luck

APT/USDT SHORTThe chart shows a strong price increase, while the indicators show signs of weakening the upward momentum. MACD: The lines are starting to converge, indicating a potential correction. RSI: The value of 68.22 is approaching the overbought zone, which also indicates the possibility of a reversal or at least a short-term correction. The price has approached the premium area (around 10.15), which may become a resistance zone. There is also a weak maximum (Weak High), which may further increase the likelihood of a rollback. Forecast: A downward price correction can be expected in the next 5 hours. It may test levels below the current mark, possibly to the support zone indicated around 8.73, where the 0.705 and Discount levels are located, or intermediate levels.

#APT/USDT#APT
The price is moving in a descending channel on the 1-hour frame
And it is sticking to it well
We have a bounce from the lower limit of the descending channel and we are now touching this support at a price of 8.30
We have a downtrend on the RSI indicator that is about to be broken, which supports the rise
We have a trend to stabilize above the moving average 100
Entry price 8.37
First target 8.68
Second target 9.00
Third target 9.45

APTUSDT (Aptos) Updated till 13-10-24APTUSDT (Aptos) Daily timeframe range. PA got into 9.73 level which got free space till 12.40. if 9.73 can be defended than it may have a push there. local support at 7.49.

APTUSDT - successfull retest the supp/res in 3d chart
iam extremly bullish
targets: 10 - 14 - 20 - 30
note: closin below grean area (7.3) is prohibited
best regards Cecilion🎯

APTUSDT Next target?? APTUSDT is currently testing a key resistance level. A breakout here could signal a significant upward movement, potentially doubling investment in the near future.
Always keep Stop loss!!
APTUSDT (1D Chart) Technical analysis
APTUSDT (1D Chart) Currently trading at $7.3
Buy level: Above $7.5
Stop loss: Below $6
TP1: $9
TP2: $11
TP3: $13
TP4: $15
Max Leverage 3x
Follow Our Tradingview Account for More Technical Analysis Updates, | Like, Share and Comment Your thoughts

APT Possible Shortso as you can see the price barely touched the demand POI and it's currently inducing buyers to actually tap in the zone later and sweeping all the liquidities and early buyers, because of this I'm considering a possible short from the supply marked inside of a 1H OTE above the equilibrium inside the premium zone to the demand zone in the down side because there is actually a reason for price to come down and take out those early buyers and tap into the demand zone then make the upward move.
so as soon as the price entered that zone and gave me confirmation I'm gonna sell the price to the downside into that demand and the see what happens next.

My point of View For APTDear Follower
I got a multi request to analyze APT
I see APT most likely will hit $50 easily
I recommend liquidate 50% of your fund at that price then start use a trilling stop under each last new bottom for the rest of the fund
Good Luck
