APT - 15% rise of Open interest - big move is comingAPT - 15% rise of Open interest - big move is coming
In a video i compared it with LINK example
watch full update
APTUSDT trade ideas


APT USDT 4H A good area to hold here and if holds easy 20–23 target
Also, Triangle breaks out it a pump
LL Longed 13.050. Will add more, slightly lower.
Stopping if doesn't hold 12,700.
A decent looking setup with good RR.

Triangle BreakoutIf Aptos breaks the triangle upwards, a long position can be taken.
Entry level: 17
TP1: 19.6285
TP2: 21.5549
TP3: 21.3189
SL: 15.66
NOT FINANCIAL ADVICES

APTOS will hits 26$ soonHello
As the chart shows us we have a flag pattern and according to TP it gives us about 200% for long position.

Long APTAPT is in an uptrend with a strong bullish continuation. I’m expecting a move that will retest its ATH. The divergence and EMAs are showing a good buying opportunity.

Apt Long Term Apt Long Term Liquidity analyse
Apt Long Term Liquidity analyse
Apt Long Term Liquidity analyse
Apt Long Term Liquidity analyse
Apt Long Term Liquidity analyse

jeffans: APTUSDT is targeting next goals and +32% after fill fwgjeffans: APTUSDT is targeting next goals and +32% after filling it's fwg 1d

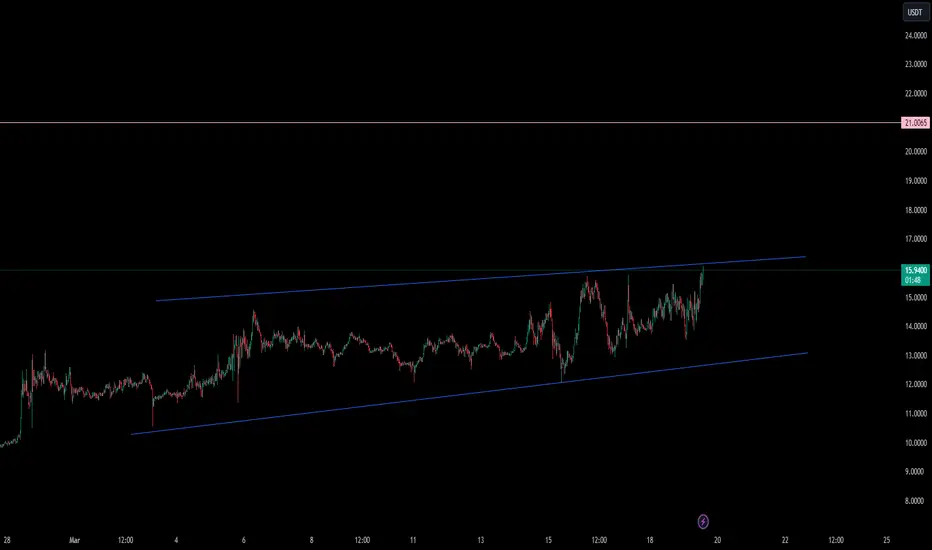
APT: Channel UpTrade setup : Price is in an Uptrend, showing relative strength as it continues to advance even during an overall market correction. Bullish break above $15.00 resistance signals continuation of an Uptrend with +10% upside potential to $16.75 near-term. Stop Loss (SL) at $13.90.
Pattern : Price is trading in a Channel Up pattern. With emerging patterns, traders who believe the price is likely to remain within its channel can initiate trades when the price fluctuates within its channel trendlines. With complete patterns (i.e. a breakout) – initiate a trade when the price breaks through the channel’s trendlines, either on the upper or lower side. When this happens, the price can move rapidly in the direction of that breakout.
Trend : Uptrend across all time horizons (Short- Medium- and Long-Term).
Momentum is Bullish (MACD Line is above MACD Signal Line and RSI is above 55).
Support and Resistance : Nearest Support Zone is $13.00 (previous resistance), then $11.00. The nearest Resistance Zone is $15.00, which it broke, then $16.75 and $20.00.

APT (Y24.P1.Video1).Cup and Handle, or just parabolic?Hi Traders,
Here are my thoughts on what is taking place, what levels are worth taking a long and what assumptions I have to think these target levels are possible.
All the best,
S.SAri

APT (Y24.P1.E2) Potential parabolic or Cup&HandleHi Traders,
#APT has been going well and held up with the recent pulbback...it didn't.
Its at resistance and like RNDR, has the makings of a parabolic structure along with a potential cup and handle.
A pullback to the grey zone would be the handle for wave 4.
All the best,
S.SAri

DOWN WE GO 🎶🎵 LOL WHAT DO YOU THINK ABOUT $APTthe most realistic idea for the moment is double top 🗻🗻
here is why
cuz i think bitcoin is about to reverse, there are plenty of altcoins with the possibility of another up wave but aptos isn't one of them SORRY not sorry.

📊#APT reaches the staged resistance zone⚠️🧠From a structural point of view, we are in a bullish trend. We have reached the stage resistance zone and there is a risk of a correction. Remember to lock in profits in time or continue to look forward without risk.
➡️There are still long targets that have not been achieved at the daily level. If you want to participate in long transactions, it is best to wait for the price to return to the neckline buying zone again before looking for buying opportunities. The profit-loss ratio and winning rate are both excellent.
➡️I don’t know if I can be given such an opportunity. If I am given such an opportunity, I will participate. If I am not given such an opportunity, I will give up.
Let's see👀
🤜If you like my analysis, please like 💖and share it💬
💕 Follow me so you don't miss out on any signals and analyze 💯

APT bullish idea Apt is in clear uptrend but it's creating Trendline Liquidity below and which is good sniper Entry zone around 13-50-13.80.
Keep eye on it and do your analysis before taking any action.

🔥 SOLANA KILLER (APTOS) EPIC OPPOTRUNITY 🔥Hello guys .
Today I want to talk about one of the possible big opportunity for this upcoming altcoin season .
as you might guess on the title of the idea ; I want to analyzing APTOS which is also m favorite ALTCOIN to hold .
So let's jump straightly into the content :
before start , I like to mention that the technique for my TA is :
1_ first of all we are going to look at the APTBTC chart for check out how this coin gonna actually perform against BTC .
2_ then we looking at the APT against us dollar chart .
as you can see in the chart above APTBTC is under a very strong resistance which is now actually trying to act as a support level because price trying to break out from it and in the daily chart we close bullish candle above it .
Also the point is ; the more stronger the resistance is , breakout could be much more difficult and when price finally break from this kind of levels we will probably see a massive reaction to the up or down side .
so we could decide that this 300 days of resistance and sells pressure from this weekly resistance is finally over if we close a weekly candle above it .
now it's time to look at APT aginst us dollar chart :
in the weekly time frame APT currently broke out from a symmetrical trianle which is also a bullish pattern and we could say the possible short term target for APT is around previous all time high around 20$ which is a very possible price target .
but the intersting fact is :
in the APTBTC chart we are currently around 300% far from previous all time high but in the APTUSDT chart we just 40% far from the all time high ; by considering this information we could say the massive rally is around the corner for APT ; also this coin is fundamentally very strong and people in the solana space knows that APT is a very strong competitor for solana .

APT/USDT | 1W 👀1. The coin continued its momentum and almost broke out of accumulation.
2. I would even say that it's not too late to enter #APT, as the potential has not been fully realized yet.
3. I've marked approximate targets on the chart.
- Not financial advice, trade with caution.
✅ Stay updated on market news and developments that may influence the price of Aptos. Positive or negative news can significantly impact the cryptocurrency's value.
✅ Exercise patience and discipline when executing your trading plan. Avoid making impulsive decisions driven by emotions, and adhere to your strategy even during periods of market volatility.
✅ Remember that trading always involves risk, and there are no guarantees of profit. Conduct thorough research, analyze market conditions, and be prepared for various scenarios. Trade only with funds you can afford to lose and avoid excessive risk-taking.
#Crypto #Aptos #Investment #APT

APT NEW INCREASE VOLUMEAPT shows a new increase in volume, which could be confirmed in the coming time frames.
We will follow the coin to see if it's able to confirm.
The reason for the volume is the trend data that this coin shows.
This coin is at basic choice on daily trends.
LONG #APTUSDTLONG #APTUSDT from $15.511
15m TF. The APT asset demonstrated local compression, where the price lows gradually increased, forming a structure known as an "ascending triangle". This usually indicates the presence of active participants on the coin. Two distinct resistance levels are visible, which were checked with a few touches when participants opened positions and set their stop losses behind them. I observe movement along these levels with an increase in volumes and activity in the order book before the breakdown.

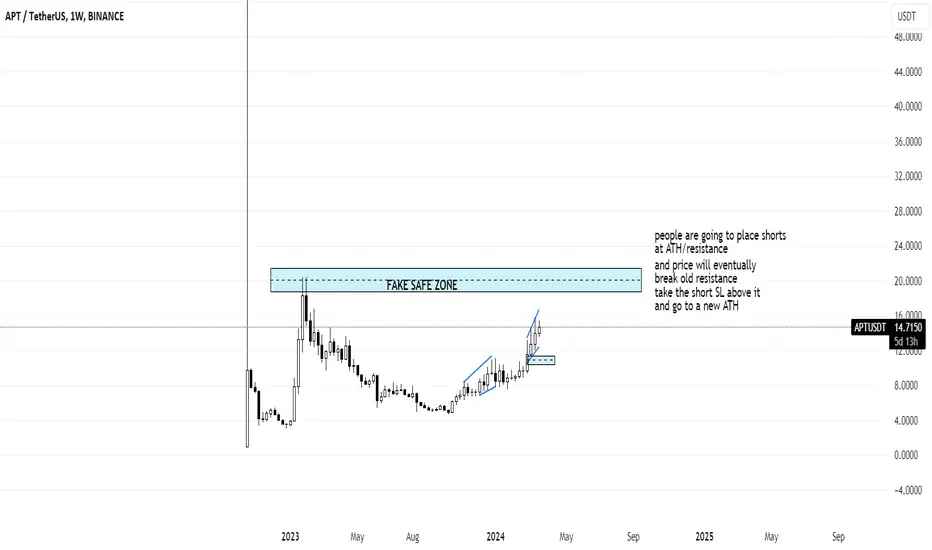
APT ideahere's my take on AMEX:APT
I believe the rally on it will be caused by people trying to short the resistance and this will give fuel/liquidity for a new ATH, another leg up
educational purpose only
nfa
APT - 1W - $100 Target - 585% increaseCan APT make a parabolic increase back to it’s alltime high after surpassing the last resistance on the daily time frame at $20? I have seen many crypto’s with similar graphs doing the same crazy stuff which even went beyond it’s alltime high direclty.

✴️ Aptos Next Target Set Near $32 (175% Potential)Aptos came out of a falling wedge "recently" but it's been five months already. It has been moving through resistance slowly producing higher highs with last week hitting the highest price level since April 2023.
This is a bullish sequence and we have a bullish bias. Even accounting for retraces and corrections the trend would continue to be up, as long as APTUSDT trades within a higher low compared to its October 2023 low.
We are expected to see continued growth in 2024 and beyond.
👉 The next target is a new All-Time High but not the final target of this bullish phase.
This target sits at $32 with 175% potential. Remember to do some planning and research before trading because charts can always change.
Thank you for reading.
Namaste.

APT - 4H - Target $30 - Elliot wave 5 - 100% increaseI earlier shared a graph from the daily time frame with a target for $20, but looking at the shorter time frames there are no resistance zones left. So potentially according to the Fib retracement indicator. APT could go quickly to even $30 which is an increase of 100%.
What are your thoughts? Feel free to share below in the comments.

APTOS #APTIt's time to go short on Apt as it is heavily extended on the upside and showing a significant bearish candle.
