Apt Usdt shortBINANCE:APTUSDT.P
Apt Usdt short
Entry 12.950
T P
12.860
12.740
12.610
12.470
12.22
Stop Loss - 13.510
APTUSDT trade ideas

APT : SHort trigger has been activatedBINANCE:APTUSDT
JUST See how you can find a new short-entering position.
it breakdown the trend line, and may provide a good opportunity for quick short

APTUSD 1WAPT ~ 1W 📈
#APT Make purchases gradually after breaking through this resistance line, with a target of at least 20%++

#APT Long Opportunity 🙂#APT Long Opportunity 🙂
Breakout of trendline
Breakout of MA
Breakout of residence.
See you on the Moon 🌙

APT: 2-type position📊Analysis by AhmadArz:
🔍Entry:
buy: 13.409
sell: 13.952
🛑Stop Loss:
buy: 13.173
sell: 14.604
🎯Take Profit:
buy:13.62-13.95
sell: 13.45-13.06-12.62-12.19
🔗"Uncover new opportunities in the world of cryptocurrencies with AhmadArz.
💡Join us on TradingView and expand your investment knowledge with our five years of experience in financial markets."
🚀Please boost and💬 comment to share your thoughts with us!

Optimistic log ScaleBut we did see x10 and much more in crypto projects already.
Wave 3 projection target is 1.618 if we anchor Trend -based fib extension tool at the origin of wave 1 , second anchor at the terminus of wave 1 and the 3rd anchor at the terminus of 2.
Conservative target , use linear scale.
Optimistic target, switch to log.

APT / APTUSDTGood Luck >>
• Warning •
Any deal I share does not mean that I am forcing you to enter into it, you enter in with your full risk, because I'll not gain any profits with you in the end.
The risk management of the position must comply with the stop loss.
(I am not sharing financial or investment advice, you should do your own research for your money.)

#APTIn time d1, it is moving in an ascending channel. After several retests of the previous major ceiling, a corner pattern is currently forming. To continue the upward path, it must break the range of 9.38 to be able to reach the supply area in time d1. Therefore, it can fluctuate in this range for the time being, and breaking $9.37 will pave the way for the currency to rise.
Please support this idea with a LIKE and COMMENT if you find it useful and Click "Follow" on our profile if you'd like these trade ideas delivered straight to your email in the future.
Thanks for your continued support.
Sincerely.

APT APTOS TradeAptos is rejecting the weekly order block. If it closes above, we can expect the price to shoot up. However, for now, in the short time frame, I find my setup to be short.

APT/USDT Main trend. Wedge. Logarithm. Timeframe 3 days. It is forming, as on many mid-liquidity altcoins—a descending wedge.
Here's what it looks like on a line price chart .
Pivot Zones. Trading Strategies. .
At the moment, the drop is -76%. Usually assets of this liquidity fall by -90%, but perhaps now is not the time yet or there is too much hype for cryptocurrency. You can work from the average set/reset price, i.e. allocate money in advance. Another option is to wait for the breakdown of the wedge.
Risk and mani-management.
Remember that with the general market situation, localized takeouts (squeezes) of stop-losses are possible. More globally, do not rule out the possibility of a so-called "black swan" (not a crypto story) since 03 2020 at the dumping of the crown virus. Then the descending wedge can break with one stick - squeeze (like the whole market), and no matter how beautiful the chart of this cryptocurrency looked earlier. If that happens, only buy with a net of orders and disconnect from media news scaremongering.
Scare and save, this is the essence of wolves earning money and loss of funds of illusorily scared and then saved sheep. .
In any case, the descending wedge has been formed (bullish formation), breaking through its resistance (breaking the downtrend) is a matter of time, not the action itself. Moreover, this very HYIP and something "valuable" should be sold (create HYIP and media demand) to those who do not appreciate such things and do not divide cryptocurrencies into good and bad, because they are just tools with the help of which "out of nothing" you can make fabulous money on the faith of fools in something abstract.
Do not catch the lows and highs of the trend. Work logic like the big market participants:
"I never know the exact future, but there is a more likely or less likely scenario, those are the ones I stick to. I am prepared for any localized outcome of events, even the less likely". Absolutely not interested in crypto news and majority opinion" .

APTUSDT.PAPTUSDT.P is in bearish trend.
Sellers are strongly active no sign of reversal here.
We wait and watch for the breakout of last LL>

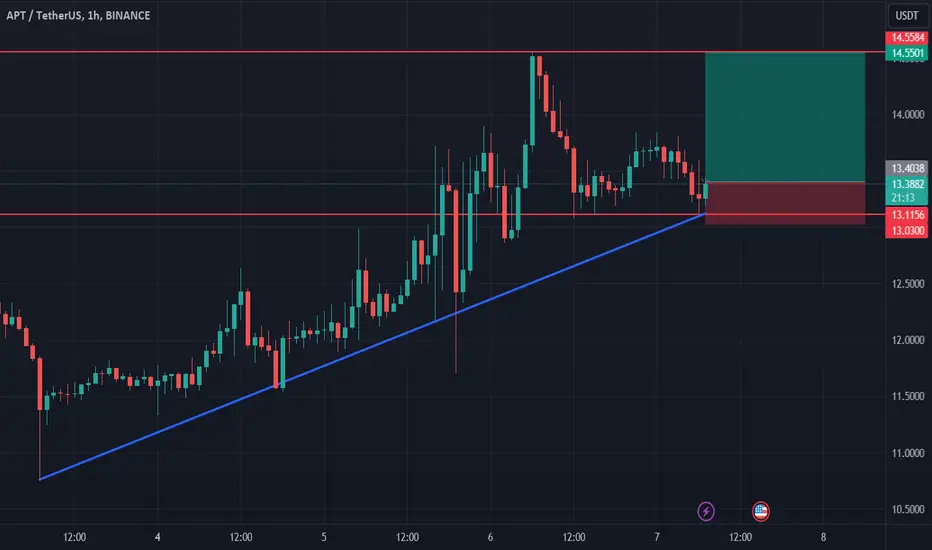
APT longAPT bounced off the ascending trendline and bounced off the support level. Bullish movement to resistance level at 14.55 is expected to happen.
APT: Resistance BreakoutTrade setup : Price resumed its Uptrend. Bullish break above $13.00 resistance signals continuation of an Uptrend with upside potential to $15.00 near-term and $16.75 mid-term. Stop Loss (SL) at $12.00.
Trend : Uptrend across all time horizons (Short- Medium- and Long-Term).
Momentum is Bullish (MACD Line is above MACD Signal Line and RSI is above 55).
Support and Resistance : Nearest Support Zone is $11.00 (previous resistance), then $10.00. The nearest Resistance Zone is $13.00, which it broke, then $15.00.

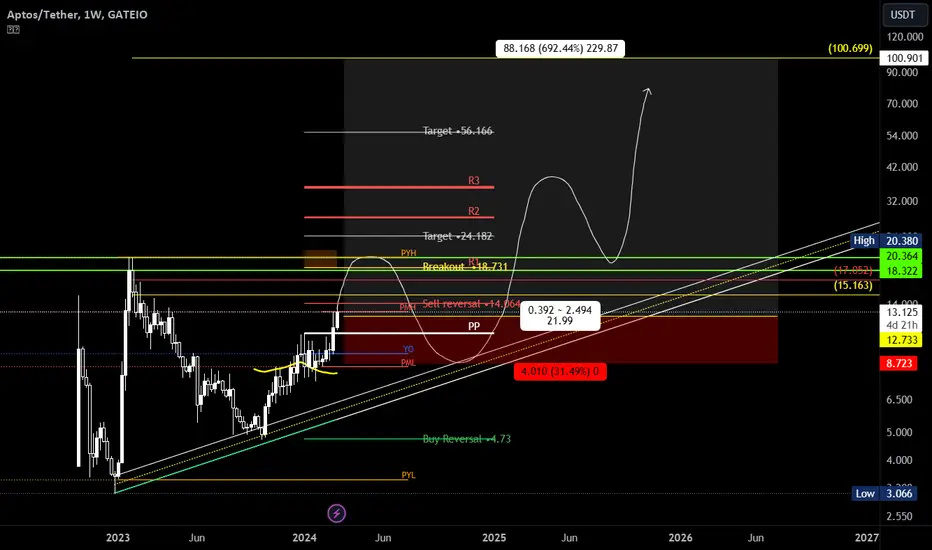
APTOS next SOLANA?Let's take a look at the Aptos project: tokenomics, investment rounds, and areas of interest to buy.
Tokenomics
The main network was launched on October 12, 2022. The initial total volume of Aptos tokens (APT) in the core network is 1 billion tokens.
Allocations:
Community 51.02% 510,217,359,767
Core Contributors 19.00% 190,000,000,000.000
Foundation 16.50% 165,000,000,000.000
Investors 13.48% 134,782,640,233.233
Link (aptosfoundation.org) to Tokenomics
Investment rounds
Let's reconcile tokenomics with investment rounds.
1. Seed - correlate to Core Contributors allocation, 19.00%.
Put in $200M at $1 billion valuation.
Received 20%.
👉 Price per token is about $1.
There is such an allocation in Core Contributors 19.00% tokenomics.
As much as I have parsed the tokenomics of projects, I will say that there are investors behind such allocation.
20% and 19% are almost parity. That's okay.
2. Series A - correlated with Investors allocation, 13.48%.
Invested $150M at a $2.05 billion valuation. Got 7.3% (out of 13.48%, Binance's 6.2% (point 3 down the line).
👉 Price per token around $2.
3. Venture Round - correlated with Investors allocation, 13.48%.
There is no official data on the size of the investment, but Bloomberg writes this:
"...Binance Labs can't disclose the amount of this latest investment, but according to He, Aptos Labs' market value is estimated at more than $4 billion. A Binance spokesperson later said He's estimate was incorrect, but did not provide an updated valuation...". The news itself (www.bloomberg.com).
Let's assume that "more than $4 billion dollars", in our terms, let it be $3.5 billion dollars.
Then the breakdown is this.
Aptos valuation $3.5 billion, Binance share 6.2% (see point 2). It turns out as follows:
We deposited about $217 million (6.2% of $3.5 billion) , and received 62 million tokens.
👉 Price per token is about $3.5.
👉 The prices are sorted out. The spread is from $1 to $3.5 per token.
Token distribution and staking
For investors in the first year on the market are available only tokens received from steaking. Approximate yield of steaking for the first year =7%.
Why approximate?
From Aptos Tokenomics: "...Currently, the maximum reward rate starts at 7% per year and is estimated at each epoch.
The maximum reward rate decreases at 1.5% per year..."
To simplify, consider a 7% return for the first year.
How many tokens will investors get for staking in a year?
Seed 13.3 million tokens in a year, 1.1 million in a month.
The purchase price of a token is $1
Series A 5.1 million tokens for the year, 426k for the month.
Purchase price of $2 token
Venture Round 4.3 million tokens for the year, per month 361k.
The purchase price of $3.5 tokens.
The initial supply was 130 million tokens on the listing.
👉 Investors are clearly not going to push the staking, but instead are interested in maximizing their earnings on tokens that are poured for staking.
As I wrote earlier in the chat, the capitalization can be anything.
Why?
1. The project is on a hype.
2. Move language is being popularized increasingly - this translates into saturation of the Aptos blockchain with new projects.
3. Hamsters don't have that many tokens to press the glass.
4. Token sale has not been conducted.
Perfect conditions for manipulation.
At the same time, there is talk online that the MOVE language is better than Rust (Solana). Nothing is stopping Aptos from running capitalization toward blockchain capitalization.
Technically
After Listing was rolled at -70% and after this disappointment, there was a month-long 500% bump (from 3$ to 20$)
After that there was a debilitating drop to 5$ and then a small 120% rise - looks like a pre-pump before the renewal of the highs.
Now the price 9.2 is going to the 11-7.9 range (redistribution or accumulation) with targets at 30-60-100$.
Best regards EXCAVO

#APT going for it had plan to buy any dip possible
started to accumulate some here. planning to accumulate as low as 8$ if price comes, have shared the setup but i am planning to accumulate apt for mid long term Q3-Q4, planning to farm for some airdrops as well on it
risking only 2%
Apt Daily Chart Analysis Apt Daily Chart Analysis
Good Chance to Long again with minimum risk strategy
Cheers boost follow support my idea


#OP/USDT#OP
The downtrend channel was broken strongly with a strong daily candle on a 1-day frame
The broken trend was retested
We also have an upward trend on the RSI indicator
We also have a higher stability moving average of 100
Entry price 9.31
The first goal is 9.67
Second goal 10.47
Third goal 11.17

Aptos $12.20 ➥ $20.00 - $125.00Aptos $12.20 ➥ $20.00 - $125.00
Take profit - $20.00 (10%)
Take profit - $27.50 (10%)
Take profit - $29.00 (10%)
Take profit - $36.00 (10%)
Take profit - $50.00 (10%)
Take profit - $60.00 (10%)
Take profit - $70.00 (10%)
Take profit - $90.00 (30%)

APTUSDT Long IdeaBINANCE:APTUSDT has recently done break out on one day time frame and we still haven't got any retest of the support which I believe has a less chance as majority of the traders are very bullish on this coin and the dips are filling quickly but if we get the chance the black box is the area to enter

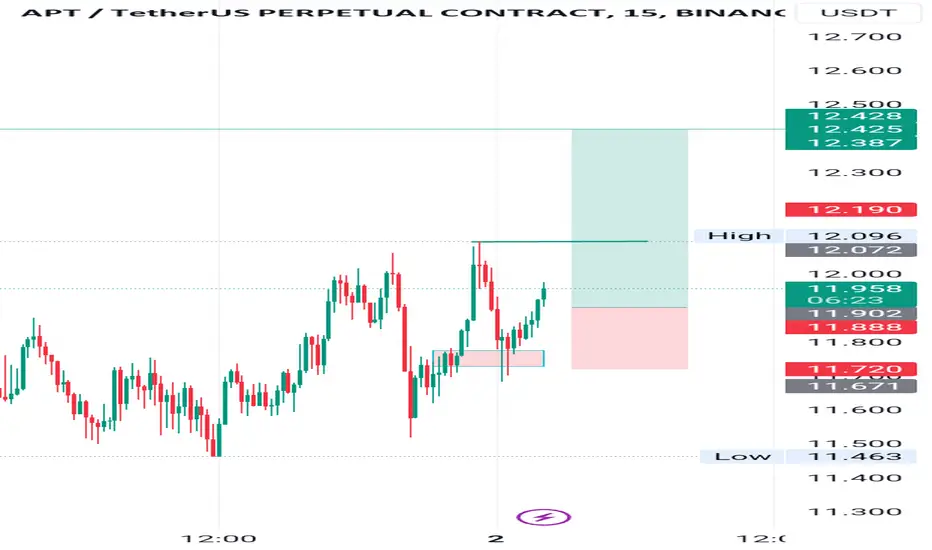
APT 15 min TImeframe TradeThe rejection on the 15-minute timeframe OB in Apt could potentially cause a price increase.
APT/USDT Keep an eye on the support, If bounce APT will back UP!💎APT has recently shown significant market dynamics. Currently, APT is facing rejection after testing the Bearish OB zone and is now retesting the support area around 10.85 to generate new momentum for a breakout.
💎 If APT successfully breaks above the supply area, its probability could signal a continuation of the upward movement, potentially leading to reaching our target area.
💎 However, if APT fails to maintain the support area and breaks below it, the next critical level is the Bullish OB area. APT must bounce from this area, as failure to do so could result in losing the support trendline.
💎 If this occurs, APT may switch back to a downward trajectory, continuing further downward movement.

APTOS (Y24.P1.E1).Support level to go longHi traders,
We have 2 levels of interest. if it dips to the 0.5, its a buy otherwise I see this nPOC holding it up on the 0.382 fib.
I also has MAs coming up ... refer to some screen shots.
All the best,
S.SAri
