APTUSDT H4HI Guys, Hope you well
Charts shows you everything's
SecondChanceCrypto
⏰16/April/23
⛔️(DYOR)
APTUSDT trade ideas

A Bit Contrarian Outlook on Aptos...A lot of you might think that this Recent Breakthrough the Trend Line might be a Bullish Scenario for Aptos. That is absolutely correct! Most TextBooks would say that a Clear Breakthrough of Trend Line is a very Bullish Setup. However at the same time Markets love to do False Breakouts I think this is what exactly will happen. I still think Pressure remains to the downside
Key Reistance Areas : As long as we stay below $14.6 I think we have a risk of testing 10$ again and who knows if we lose Ten Dollars then no one will stop this thing to come at $8. If that $14.6 gets broken I will be absolutely wrong about it and change my opinion about its outlook. Also the Recent Upside from $10.6ish level doesn't looks Impulsive at all it looks like a Corrective Pattern.
Anyways let's see we have our Line in The Sand level at $14.6 so let the battle begin🙂

aptFor spot buying in two areas, with the specified loss limit. If you made the purchase in the first area, and you wanted to average, the second area and the second loss limit will be activated.

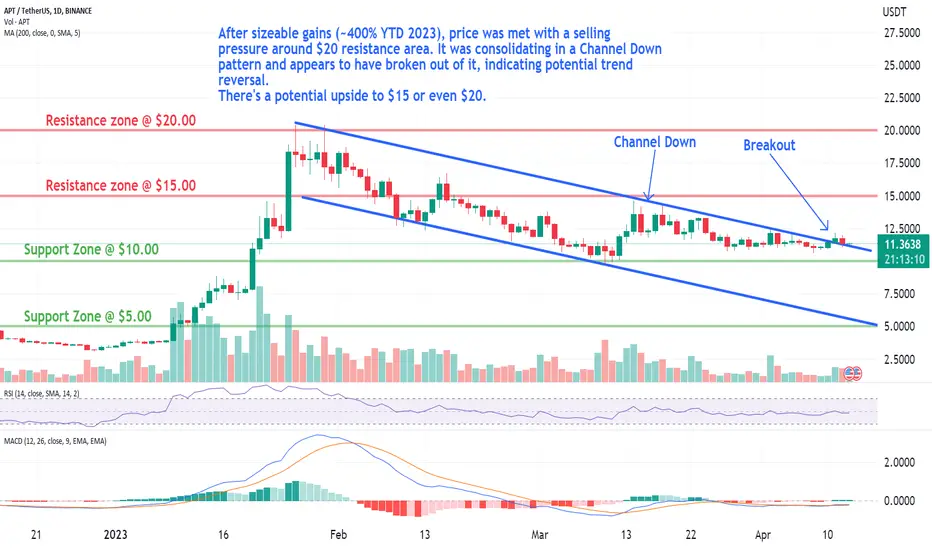
APT: Channel Down BreakoutTrade setup : After sizeable gains (~400% YTD 2023), price was met with selling pressure around HKEX:20 resistance area. It was consolidating in a Channel Down pattern and appears to have broken out of it, indicating potential trend reversal. There’s potential upside potential to $15 or even $20.
Pattern : Price was trading in a Channel Down pattern. With complete patterns (i.e. a breakout) – initiate a trade when the price breaks through the channel’s trendlines, either on the upper or lower side. When this happens, the price can move rapidly in the direction of that breakout.
Trend : Downtrend on Medium-Term basis and Uptrend on Short- and Long-Term basis.
Momentum is Bullish (MACD Line is above MACD Signal Line and RSI is above 55).
Support and Resistance : Nearest Support Zone is $10.0, then $5.0. The nearest Resistance Zone is $15.0, then $20.0.

Target would be 20$🔸We can see apt breakout the descending channel in 12h chart.
🔸Now testing the 0.382 fib level which would be broken soon
🔸My target is 20$
Dont forget to support us with ur like, comment and follow for more ideas like this🎯

Does the short start from here and then go up again?This motive wave consists of five waves, so the real decline cannot start from this temporary peak, because wave B does not come with five waves, only three waves.. A small correction wave is expected for area No. 4, including a final rise in a fast and short wave C, and this will end Every upswing starts with a big deep correction

APTUSD ❕ under the liquidityAPT is under the liquidity level.
TD Sequential indicator has formed a reversal signal down at 4H Timeframe.
The RSI chart is moving in the sellers area (1H and 30m TFs)
I believe that the asset will continue to decline.


APTUSDT wants the new breakout?APTUSDT is testing a static resistance level on the 1-day chart, after a bounce from the 10 $ area where the market created a demand zone.
The demand zone indicates that there was a significant buying activity in the 10 $ area, which means that there is a possibility of new liquidity being added to the market. This could result in a new breakout from the $12.5 resistance level.
Based on Plancton's Rules, which are guidelines for trading cryptocurrencies, a new long position could be considered. If the price manages to break through the resistance level at $12.5, it could indicate a bullish trend, and traders could look to enter a long position with the expectation of a continued uptrend.
–––––
Follow the Shrimp 🦐
Keep in mind.
🟣 Purple structure -> Monthly structure.
🔴 Red structure -> Weekly structure.
🔵 Blue structure -> Daily structure.
🟡 Yellow structure -> 4h structure.
⚫️ Black structure -> <= 1h structure.
Follow the Shrimp 🦐

APT USDT | Triangle Breakout !!#APT /USDT
- The price Finally break the triangle up with a good bullish potential
🟢Entry price: from now at 12.6 to 11.95
🎯Targets:
|> 13.79
|> 15
|> 16.28
🔴Stop-loss: Daily candle closes under 11.7
➡️Recommended risk: 0.25%
➡️Recommended total Positions Size: 2.5%
-------------------------------------------
if you missed! here are some of our recent Altcoin trades that are available to enter :
#ACAUSDT | ready for a bullish impulse
#COCOS/USDT | full details trade!
#MANA | The breakout of a bullish flag !

Whether it can rise above the volume profile is keyHello?
Traders, welcome.
If you "Follow", you can always get new information quickly.
Please also click "Boost".
Have a good day.
** Analysis of the BTC chart publishes new ideas once a week.
** However, we publish new ideas when volatility occurs or when we show signs of diverging from our expectations.
** Excluding the above situation, BTC analysis is listed as a daily update.
-------------------------------------
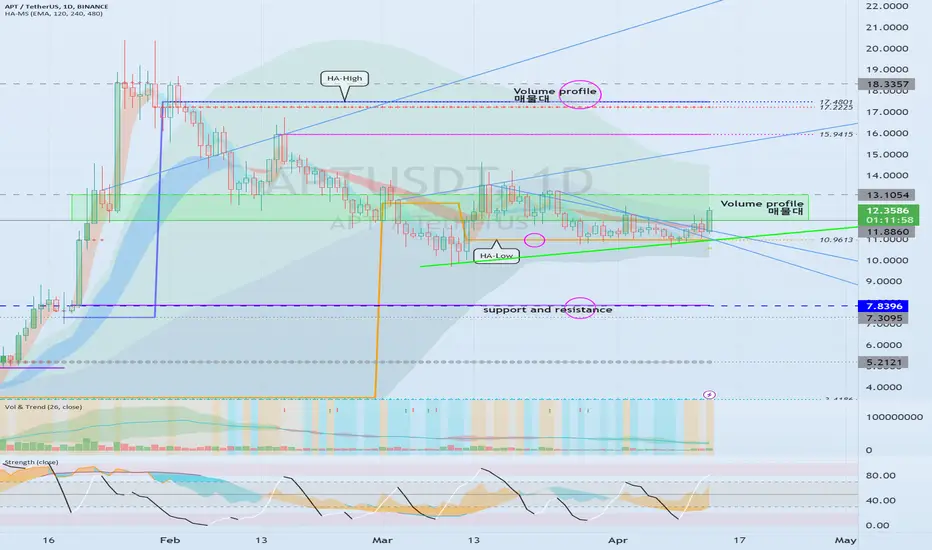
(APTUSDT chart)
The key is whether it can rise above the volume profile section formed in the 11.8860-13.1054 section.
If it declines, you should check for support around 7.8396.
Since it was supported and rose near the HA-Low indicator of the 1D chart, if it rises above the selling range of 11.8860-13.1054, it is expected to rise to the vicinity of the HA-High indicator of the 1D chart.
However, it may be created by moving the HA-High indicator as it rises.
-------------------------------------------------- -------------------------------------------
** All descriptions are for reference only and do not guarantee profit or loss in investment.
** Even if you know other people's know-how, it takes a considerable period of time to make it your own.
** This is a chart created with my know-how.
---------------------------------

APT: Channel Down BreakoutTrade setup : After sizeable gains (~400% YTD 2023), price was met with selling pressure around HKEX:20 resistance area. It was consolidating in a Channel Down pattern and appears to have broken out of it, indicating potential trend reversal. There’s potential upside potential to $15 or even $20.
Pattern : Price was trading in a Channel Down pattern. With complete patterns (i.e. a breakout) – initiate a trade when the price breaks through the channel’s trendlines, either on the upper or lower side. When this happens, the price can move rapidly in the direction of that breakout.
Trend : Downtrend on Short- and Medium-Term basis and Neutral on Long-Term basis.
Momentum is Mixed as MACD Line is above MACD Signal Line (Bullish) but RSI ~ 50 (Neutral).
Support and Resistance : Nearest Support Zone is $10.0, then $5.0. The nearest Resistance Zone is $15.0, then $20.0.
APT 🚀 IS BULLISH LONG🚀APT/TETHERUS BINANCE
Hi, dear traders. how are you? Today we have a viewpoint to BUY/LONG
This is the time to buy, the downward line was broken with a positive sign, and the 4-hour candlesticks are above mouving avrige 209, which indicates the positivity of the trend. The three goals in the chart

APTUSDT likely to hit 4h support and bounce from thereThe price is currently trading above 4h support 4HS1 as marked on the chart. It is likely that the price will hit this support and bounce from there. A long will be favorable from there for a target towards 11.89. If this support is lost, the price shall hit next 4h support 4HS2 and another long can be attempted from there with a target towards 11.63 area.

APT long term long.Just focus on long term analysis. There are pumps in every token unlocks for APTOS. Keep an eye on their token unlocks on Token Unlock's website.

APT/USDT🔵🐇 #APT/USDT
🪄 IDK Price Will Reach To The Untouched liquidity magnet zone or not but there are two strong Fresh LQ around 8 -7 & 5.5
and I will think about a solid and strong midterm buy there !
NFA - DYOR
#apt #aptos #eth #btc #bitcoin #ethereum #cryptocurrency #crypto #Trade #trading #Trader #Signal #forex #Scalp #altcoins #chart #RTM #ICT
@aliceinmoneyland

APT/USDT🔵🐇 #APT/USDT
🪄 APTOS Scalp Position Based On Fresh Liquidity and Order Blocks and Structures
#apt #aptos #eth #btc #bitcoin #ethereum #cryptocurrency #crypto #Trade #trading #Trader #Signal #forex #Scalp #altcoins #chart #RTM #ICT
@aliceinmoneyland

APT Short PBFinally took both levels at extremes of range but market seems heavy at support area. What will come first though.. a squeeze for the late shorts or puke?

APTOS potential long swing aptos went down and taken the liquidity from below and now if the bullish sentiment remains in the market it'll go high to grab the liquidity and then move further...

APT on Wave-AnalysisAPT has completed wave 3 and retraced to complete corrective wave 4. As a principle, it must not retrace more than the blue thick line which is the peak of wave 1. It is also a typical Fib ratio, 0.382 of 3-W. In our case here, wait for the price channel to be penetrated to confirm the bullish move and the start of Wave 5. The blue thick line is your stop-loss.
Cheers,

APTUSDT at daily support but better to wait before going longThe price has hit the daily support as expected in our previous post. This also explains the initial bounce. However it seems price may dip below the support although briefly if not for a long duration. Therefore, I think a bit of patience will be desired before taking a long from this support. If the price reaches 10.14, a long would be more favorable.

APT TRADE SET UPIf we dip below the C corrective wave low we will be looking at a target to the downside. If we hold, it looks like we'll have an impulsive move to the upside.
