AptosAptos successfully breakout from Bullish Symmetrical Triangle.
Target of this pattern breakout is 11.30$.
DYOR
APTUST trade ideas

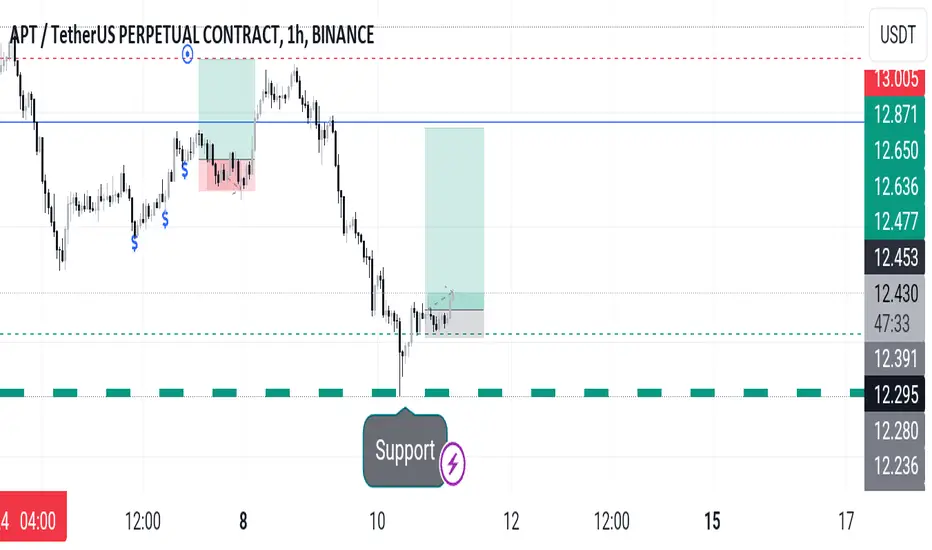
#APT Possible Scenario#APT Possible Scenario
We are below high volume.
We are in clear downtrend.
Trend Following Pattern.
Waiting for breakdown and retest

💰 #APT/USDT APT is testing the bottom of ascending channel i💰 #APT/USDT
APT is testing the bottom of ascending channel is intact on weekly timeframe💡
Bearish priority🐻

$60 for $APT/USDT soon! 🚀 "📈 Divergence on 1H, 4H & daily for $APT/USDT! 🚀 Time to accumulate via spot buys! 💎 Let's strategize! #APT #Crypto"
"🎯 Setting our sights higher: Targeting $60 for $APT/USDT soon! 🚀 But the bull run could take us beyond $100! 🌟 Let's aim for the stars! 💥💰 #Crypto"

APTUSDTAPTUSDT Elliott Wave Technical Analysis
Mode: Corrective
Structure: Flat
Position: Wave (4) of (C)
Direction: Wave (4) of (C) is still in play
Details: Wave (4) is still in play which I expected to be end around 12.5-11.8 which will be my entry point.
Next Direction: Wave (5) which will complete the next higher Degrees Wave (C)
Target : the area between 22.3-22.8 with about 80% profit, keep your eyes on on the first target around 20.08, the price may bounce back from this area.
Wave Cancel invalid level: Daily closing below 11 with 11% loss.
Disclaimer:
This analysis is intended for educational and informational purposes only and should not be construed as financial advice. Always conduct your own due diligence and consult with a professional financial advisor before making investment decisions.

APTUSDT Long Spot Trade / after the last correctionafter the last correction APT break the Base Channel and retest it and entered wave 2 territory, and as I see BTC and ETH not complete there correction wave yet, and the same case with most of the other Crypto, so that mean that the price will go deeper, which make our 5 impulse Wave Idea invalid.
I have completely re-analyzed this coin:
APTUSDT Elliott Wave Technical Analysis
Mode: Corrective
Structure: Flat
Position: the red Wave (c) of the orange Wave (b)
Direction: the red Wave (c) is still in play
Details: the red Wave (c) is still in play which I expected to be end around 6.3- 5.5 which will be my entry point, if this area is breached then the next entry point will be around 3.7
Next Direction: next higher Degrees orange Wave (b)
Target : the area between 22.3-22.8 with about 300% profit, keep your eyes on on the first target around 20.08, the price may bounce back from this area.
Wave Cancel invalid level: Daily closing below 3 with 45% loss.
NOTE:
don't sell everything in the 22.3-22.8 wait for price reverse confirmation, the price may reach the 27$ level.
For long-term investment, this currency can reach the 40-60$ levels after going in a correction from the 27$ levels
Disclaimer:
This analysis is intended for educational and informational purposes only and should not be construed as financial advice. Always conduct your own due diligence and consult with a professional financial advisor before making investment decisions.

APT Long Side Move Expect APT appears to be retesting a bottom Fibonacci channel. If it experiences a pump, anticipate a potential 150% upside.
Entry range: $11.720 - $12.110
Expected target price: $21 and $30
Stop loss set at $10.45
With the risk-to-reward ratio for this trade being 1:14, we can afford to take on a favorable risk.
As traders, it's advisable to wait for a 15-minute confirmation before entering the trade.
Good Luck!

APT Channel ImportanceIn the weekly analysis of Aptos (APT), we observe an upward trend.
The new lows and highs are higher than the previous ones, indicating the sustainability of the bullish trend.
After the end of the corrective wave and the price reaching the channel's bottom, a strong upward trend has formed. Based on daily patterns, the price is expected to rise towards the channel's top. It is important that the bottom of the channel is maintained to continue the upward trend.

APT: Oversold at SupportTrade setup : Trends are mixed. After a bearish breakout from Channel Up pattern, price has pulled back below 200-day moving average (~$9.30), which could signal a bearish trend reversal to downtrend. However, price is now oversold (RSI < 30) just as it nears $8.00 support and could bounce up near-term. Swing traders: this could be an attractive swing trade entry with +20% upside to $11.00. Stop Loss (SL) level at $7.80.
Trend : Downtrend on Short- and Medium-Term basis and Uptrend on Long-Term basis.
Momentum is Bearish but inflecting. MACD Line is below MACD Signal Line and RSI is below 45 but momentum may have bottomed since MACD Histogram bars are rising, which suggests that momentum could be nearing another upswing.
Support and Resistance : Nearest Support Zone is $8.00, then $5.50. The nearest Resistance Zone is $11.00, then $13.00 and $19.50.

APT - trapped sellers after 36% dropAPT - trapped sellers after 36% drop
APT dropped 36% since high $19.33
at this moment open interest started rising a lot with the NEgative delta
In most cases after such a drop short sellers become trapped and prices go oppositely to take their SL
In a video i share with u 3 ideas of how to take trades and potential targets

APT - Best are for LONG nearly 7.4APT - Best are for LONG nearly 7.4
In a video u can see that price liquidate a lot of buyers also dropped by 60%
at that key level u have a best opportunity to take LONG for LONG terrm

APT can ascend further!
Hi.
BINANCE:APTUSDT
Today, I want to analyze APT for you in a 2D time frame so that we can have a SHORT-term view of APT regarding the technical analysis. (Please ✌️respectfully✌️share if you have a different opinion from me or other analysts).
Aptos may be forming a cup and handle pattern
This is a bullish pattern, indicating the potential for an upward breakout in future
Now, we're in the handle-forming phase, representing a temporary pause in the uptrend
Stay awesome my friends.
_ _ _ _ _ _ _ _ _ _ _ _ _ _ _ _ _ _ _ _ _ _ _ _ _ _ _ _ _ _ _ _ _
✅Thank you, and for more ideas, hit ❤️Like❤️ and 🌟Follow🌟!
⚠️Things can change...
The markets are always changing and even with all these signals, the market changes tend to be strong and fast!!

APT | Remarkable Relative Strength | 130%Aptos shows remarkable strength during the recent BTC dump. This is usually a good sign for future price development. It also holds nicely above the midpoint of the trading range.
My first target is the 1x range extension at around $35.

Level to buy APTUSDT on BTC correctionHere is some price blocks to buy APT on possible deep correction move on Bitcoin

APTOS TO THE MOON ☪ The support level for Aptos has been rejected, and it is currently in a lower time frame order block. Consequently, I anticipate a significant bullish movement in the price of this coin.

APTOS BREAKS THE SUPPORT LEVEL🤯 I believe Aptos has broken the support level, which has made me bearish on it. Consequently, I have entered a short position.

APT/USDT: Watch for False Break, Enter on 1-2-3 Reversal PatternAPT/USDT is teetering on a support level, with a projected price movement in anticipation. A potential strategy is to observe the support for a potential breach, wait for a false break and a price recovery, and then execute a trade based on the classic 1-2-3 reversal pattern to capitalize on the upward trajectory. The projection targets a 23.76% gain with a risk/reward ratio of approximately 3.04. Entry should be timed post-recovery for optimal trade positioning.

APTUSDTIn my opinion we can imagine a cup and handle pattern for APTUSDT on chart for incoming super bullrun.
NOT FINANCIAL ADVICE

APTOS LONGThis coin, Aptos, has successfully rebounded from the support level, strengthening my bullish sentiment towards it.

APTUSD 5DAPT ~ 5D 📈
#APT We expect the Cup and Handle pattern to form from here. Make purchases gradually in this Support Zone with a minimum target of 20%+ 📈


APT: Pullback in UptrendTrade setup : After a bearish breakout from Channel Up pattern, price has pulled back to $13.00. However, it remains in an Uptrend. Momentum is inflecting bullish again (MACD Histogram rising) and price could swing back up to $16.75 for +25% potential upside. Stop Loss (SL) level at $11.90.
Trend : Downtrend on Short-Term basis and Uptrend on Medium- and Long-Term basis.
Momentum is Bearish (MACD Line is below MACD Signal Line, and RSI is below 45).
Support and Resistance : Nearest Support Zone is $13.00, which it broke, then $11.00. The nearest Resistance Zone is $16.75, then $20.00.
