APTUSDT 1D AnalysisAPT ~ 1D Analysis
#APT Buy back gradually from here if you still have confidence in this coin with a short term target of at least 15%+ and a long term target of $15
APTUST trade ideas

it's time to going up for APTUSDT!!!!!before buying, please check for being sure about your opinion about this CRYPTOCURRENCY!!!
(in every target you want, closed the position but our target is the third one)
*Guy's the entry place is importance things in enter in a position and be careful do not going up your leverage over 7x ,all things it's about risk management*
*************************************************
if you want to enter in this position:
Enter Price: 4.761
Target1: 4.777
Target2: 4.800
Target3(Final Target): 4.841
Stoploss: 4.721


TradeCityPro | APT: Triangle Squeeze Near Crucial Support Zone👋 Welcome to TradeCity Pro!
In this analysis, I’ll be reviewing the APT coin. The Aptos project is one of Ethereum’s Layer 2 solutions.
✔️ This project’s token currently holds a market cap of $3.1 billion and ranks 32nd on CoinMarketCap.
📅 Daily Timeframe
On the daily chart, you can see a very strong support level at 4.718, which has been tested multiple times. The price has once again reached this zone.
💥 A descending trendline can also be drawn, showing clear reactions from the price. The area between this trendline and the 4.718 support forms a triangle pattern.
⭐ If the 4.718 support breaks, a short position could be considered. A breakdown below 37.78 on the RSI would serve as strong confirmation of bearish momentum.
📉 The initial target for the short would be 4.338. However, if a new bearish leg forms and the market heads toward lower lows, a drop toward the 3.12 support level is also possible.
📊 Confirmation of a bullish reversal would come from a breakout above the descending trendline. If this trendline is broken and the 6.152 trigger activates, it would justify opening a long position or even buying in the spot market.
🛒 When it comes to spot purchases, the most important factor is a trend reversal in Bitcoin dominance. Personally, I do not buy any altcoins on spot until Bitcoin dominance shifts downward on the daily chart — I only trade them in futures.
📝 Final Thoughts
This analysis reflects our opinions and is not financial advice.
Share your thoughts in the comments, and don’t forget to share this analysis with your friends! ❤️

APTOS $APTI don't think I need to explain what APTOS is here.
Right now, it's a good point for a swing position, which is why you're seeing this post.
Best regards EXCAVO

Aptus Apt usdt Daily analysis
Time frame daily
Risk rewards ratio >2 👈👌
Target 7.4$
Pattern = two bottom

APTUSDTThe specified range is important, and if the upward trend is maintained, market sentiment remains positive, liquidity enters, and we see good momentum from this currency in the above timeframe, we can consider the specified scenario probable.

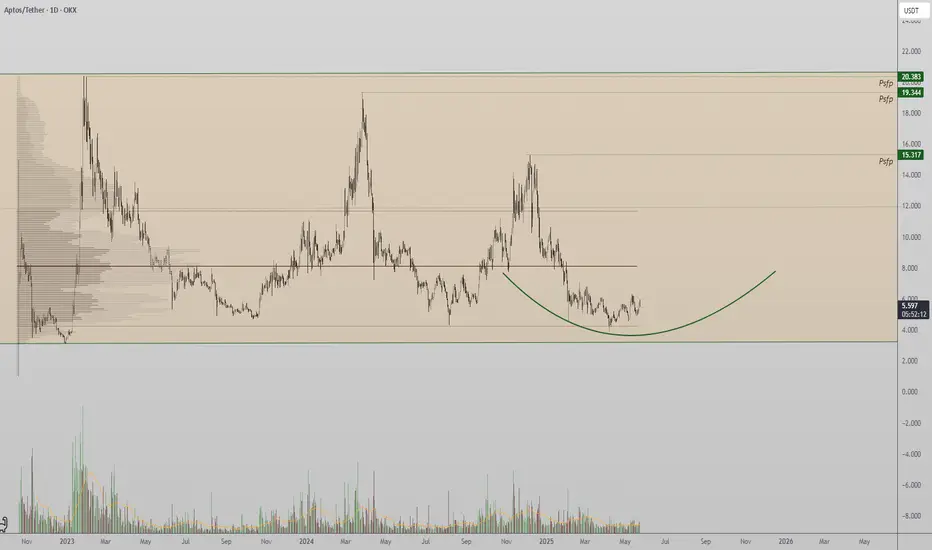
Aptos Positioned at Key Buy Zone — Eyes on POC BreakoutAptos is currently trading at a significant technical support zone — the range low of a major high time frame consolidation that has held since 2022. This range low presents a compelling opportunity for accumulation, especially as price hovers around the value area low, near the $24 level.
The market structure suggests a potential rounding bottom formation, provided price continues to close above this region. This could signal a build-up in demand, reinforcing the idea that Aptos is undergoing an accumulation phase at the lower bounds of its multi-year range.
The most critical level to watch is the point of control (POC) — the area with the highest volume traded within the range. A clean break and sustained close above the POC would mark a significant shift in market dynamics and increase the probability of an expansion move towards the range high.
Historically, once Aptos has managed to reclaim the POC, price has rallied to the $19–$20 zone. This recurring pattern adds more weight to the breakout scenario and gives traders a clear blueprint of what could unfold next.
From a technical standpoint, until the POC breaks, price action is likely to remain in a sideways, accumulation-type structure. However, the confluence of support at the value area low and the extended time spent consolidating at this range increases the odds of a breakout attempt.
A sustained hold above $24, followed by a breakout of the POC, would set the stage for a potential strong upward rotation toward the upper bounds of the range.
Accumulation appears to be underway. A confirmed break of the point of control would shift momentum strongly in favor of bulls and open up targets toward the $19–$20 region.
#APT/USDT#APT
The price is moving within a descending channel on the 1-hour frame and is expected to break and continue upward.
We have a trend to stabilize above the 100 moving average once again.
We have a downtrend on the RSI indicator that supports the upward move with a breakout.
We have a support area at the lower limit of the channel at 5.50, acting as strong support from which the price can rebound.
Entry price: 5.70
First target: 5.82
Second target: 6.00
Third target: 6.17

#APT/USDT#APT
The price is moving within a descending channel on the 1-hour frame, adhering well to it, and is heading for a strong breakout and retest.
We are experiencing a rebound from the lower boundary of the descending channel, which is support at 4.95.
We are experiencing a downtrend on the RSI indicator that is about to be broken and retested, supporting the upward trend.
We are looking for stability above the 100 Moving Average.
Entry price: 5.22
First target: 5.34
Second target: 5.47
Third target: 5.65

APTUSDT - LONG-Price retesting confluence of TL and 0.786 Fib level.
- Prior FVG has closed.
-Pin bar with fairly good volume indicate demand zone.
-Good risk: reward ratio with tight stop.

APT 1W LONGAMEX:APT is carving out a two-year range, currently hugging the lower boundary at $4.00–$5.00—a level that’s held firm through multiple tests and speaks to solid accumulation. Up top lies untapped liquidity around the highs, setting the stage for a potential breakout impulse.
Key Observations
• Support tested and defended at $4.00–$5.00 (green zone)
• Accumulation in play with early reversal patterns forming
• Untested highs above range (~$13.00 and beyond ATH) mark natural targets
• Historic liquidations at both extremes reinforce range integrity
Trading Plan & Levels
– Primary: Hold long from $4.00–$5.00, scale in more on a clean 1W close above $6.00
– Alternative: If price drops below $4.00, pause and reassess for a capitulation low setup
– Buy Zone: $4.00–$5.00
– Add Zone: Weekly close > $6.00
– Take-Profits: First at $13.00 (upper range), then $20.00+ (untapped highs/ATH)
– Stop-Loss: Weekly close < $4.00
Triggers
Weekly close above $6.00 → add/reinforce longs
High-volume rejection off $4.00–$5.00 → initial entry signal
Swift breakout above range → consider aggressive partial profit-taking
As long as $4.00 holds, the range-bound long remains valid—watch for a decisive move through $6.00 to unlock a run toward the upper band and beyond. 🚀

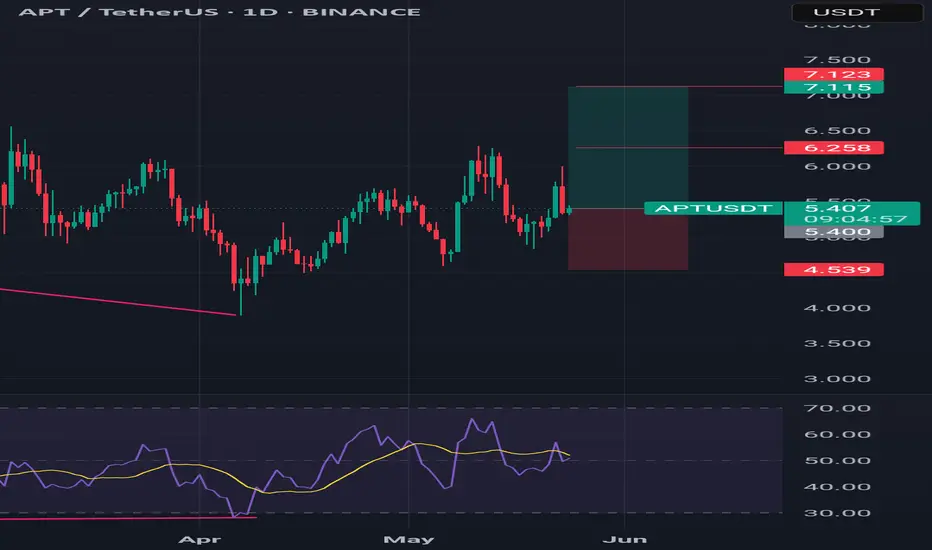
Aptos Long Term ViewAptos taken out almost all liquidation from below side, it can fall more towards 3.5$ to take out all new buyers and then push towards 15$, remember 15-16$ is an unmitigated zone, sooner or later this imbalance zone will be filled. So if your an investor and want easy 3x gain then buy apt from 5$ 2nd entry 4$ and last buying from 3.5$, ignore lower timeframe volatility and BTC movement, these entries are easily achievable if market crashes by any chance so you can close your position at breakeven. While 7.19-7.50$ area is crucial to break, once this zone is broken there is nothing upside that can stop Aptos from hitting 15$. Any daily candle closing above the marked zone will confirm trend shift, before this trade setup is like high risk n reward. While I'm very confident on Aptos that it will hit 15% mark.

APTUSDT 1D Analysis APT ~ 1D Analysis
#APT Buy back gradually from this support block with a short term target of at least 15%++ from here.

Aptos scalp n swing trade setupAptos is facing daily Order Block resistance , While on Weekly clearly showing to take out the previous high 15-16$, It's a weekly TF so it will take time. On a day trade you can take long position from the mentioned zone, while in upcoming days it's gonna hit 7.42$ at least to fill the imbalance even if it's a bear market. If any 1hr candle closes below the mentioned zone then it will take correction for short term of period then it will take flight to towards the 15-16$. If you are investor then accumulate between 4.5-5$ and set tp and forget it. If you wanna take the long position then take it from the mentioned zone if candle closes below the zone then wait for the retest and close on breakeven.

TradeCityPro | APT: Testing Momentum After Key Breakout👋 Welcome to TradeCity Pro!
In this analysis, I want to review the APT coin for you. This coin belongs to the Aptos project, which is one of Ethereum’s Layer 2 solutions.
⚡️ APT, with a market cap of $3.6 billion, is currently ranked 32 on CoinMarketCap.
⏳ 4-Hour Timeframe
As you can see in the 4-hour timeframe, after finding support at the 4.687 zone, the price made a very sharp bullish move and reached 5.708. After an initial rejection, it has now managed to stabilize above this level.
🔍 If this bullish move continues, we could see another upward leg, with the next resistance at 6.047. If this level breaks, the price could move up to 6.752.
✔️ There’s a very important RSI ceiling at 80.76, which has consistently caused rejections after sharp upward moves. If the price aims for another bullish wave, this level will be critical and could mark the top of the move.
⭐ A breakout above this level seems unlikely for now, since 80.76 is a very high reading for the RSI oscillator, and the chance of it breaking is quite low. But if it does happen, we could see an extremely sharp and unusual move.
🔽 As for a bearish scenario and short positions, we currently need to wait for a trend reversal. If the breakout above 5.708 turns out to be fake and the price starts moving downward, we can look for a trigger in a lower timeframe to enter.
🔑 But keep in mind that short positions in these market conditions are very, very risky. And if you do open such a position, make sure to secure profits frequently with small risk-to-reward setups.
📝 Final Thoughts
This analysis reflects our opinions and is not financial advice.
Share your thoughts in the comments, and don’t forget to share this analysis with your friends! ❤️

$APT/USDT 12H Charts$APT/USDT – Long Trade Setup
- Entry Zone: CMP
Targets:
• TP1: $6.80
• TP2: $8.20
• TP3: $10.83
Stop Loss: $4.85
- Leverage Suggestion: Use 3–5x leverage max.
Breakout from long-term downtrend with bullish momentum building.
Trade with proper risk management!

#APT/USDT#APT
The price is moving within a descending channel on the 1-hour frame, adhering well to it, and is heading for a strong breakout and retest.
We are seeing a bounce from the lower boundary of the descending channel, which is support at 4.60.
We have a downtrend on the RSI indicator that is about to break and retest, supporting the upward trend.
We are looking for stability above the 100 Moving Average.
Entry price: 4.76
First target: 4.88
Second target: 5.03
Third target: 5.23

APT Coin Forming an Inverted Bullish Head and Shoulders! 🔥 APT Coin Forming an Inverted Bullish Head and Shoulders! 🚀
APT Coin is currently forming an inverted bullish head and shoulders pattern! 🧠 If the price breaks the red resistance line (neckline), this could trigger a strong bullish move! 📈
Keep an eye on this breakout – it's setting up for some exciting action! 🔥
Let’s catch this move together! 🌊💸


Scamtos and it's futureWe've all seen how the indian founder ( a.k.a scammer) sold his stack of APT when it was at 14-15$ and left the company. A few weeks later the market crashes and APT is now ~ 5$.
- Aptos during 3 years didn't succeed nor in good gains or adoption.
- The asian founder that is in charge now ( a.k.a new scammer) just proposed the community to cut staking rewards from 7% to 3%. This will make whales re-think their holdings
Meanwhile SUI did a few times already 4-7x'es and it attracts more users and community so it's clear SUI will be the winner of the cycle ( but it's market cap is already 12 bln circulating so ...)
For me, it's clear that APT, from the very beginning, was meant for 1 thing only: Dump on retail long-term, while "building" to show that they are working, in other words : an old form of scam but with new design :)
This was my biggest dissapointment as investment all these years and I'm not sure it has any future but : you never know ) If bullrun continues, it might pump 10x one day

APTUSDT 1D AnalysisAPT ~ 1D Analysis
#APT Buy after successfully penetrating this resistant line with a short -term target of at least 10%+ from here.
