#KZG – reached area of significant value, set for big Q4Joint venture between #MVVIVE and #Kazera is expected to increase six-fold to 35,000 tons of gravel per month.
Profits from the joint venture, which will become operational by 1 October 2021, look for a strong bounce from these levels
Next report date
—
Report period
—
EPS estimate
—
Revenue estimate
—
−0.0022 GBP
−2.82 M GBP
6.00 K GBP
185.36 M
About KAZERA GLOBAL PLC ORD GBP0.001
Sector
Industry
CEO
Dennis Vernon Edmonds
Website
Headquarters
London
Founded
2006
ISIN
GB00B830HW33
FIGI
BBG000VXY317
Kazera Global Plc engages in the exploration and development of mineral properties. It operates through the following segments: Holding Company, Diamond Mining Activity, and Mineral Sands Mining Activity. The company was founded on February 3, 2006 and is headquartered in London, the United Kingdom.
Summarizing what the indicators are suggesting.
Oscillators
Neutral
SellBuy
Strong sellStrong buy
Strong sellSellNeutralBuyStrong buy
Oscillators
Neutral
SellBuy
Strong sellStrong buy
Strong sellSellNeutralBuyStrong buy
Summary
Neutral
SellBuy
Strong sellStrong buy
Strong sellSellNeutralBuyStrong buy
Summary
Neutral
SellBuy
Strong sellStrong buy
Strong sellSellNeutralBuyStrong buy
Summary
Neutral
SellBuy
Strong sellStrong buy
Strong sellSellNeutralBuyStrong buy
Moving Averages
Neutral
SellBuy
Strong sellStrong buy
Strong sellSellNeutralBuyStrong buy
Moving Averages
Neutral
SellBuy
Strong sellStrong buy
Strong sellSellNeutralBuyStrong buy
Displays a symbol's price movements over previous years to identify recurring trends.
Related stocks
Frequently Asked Questions
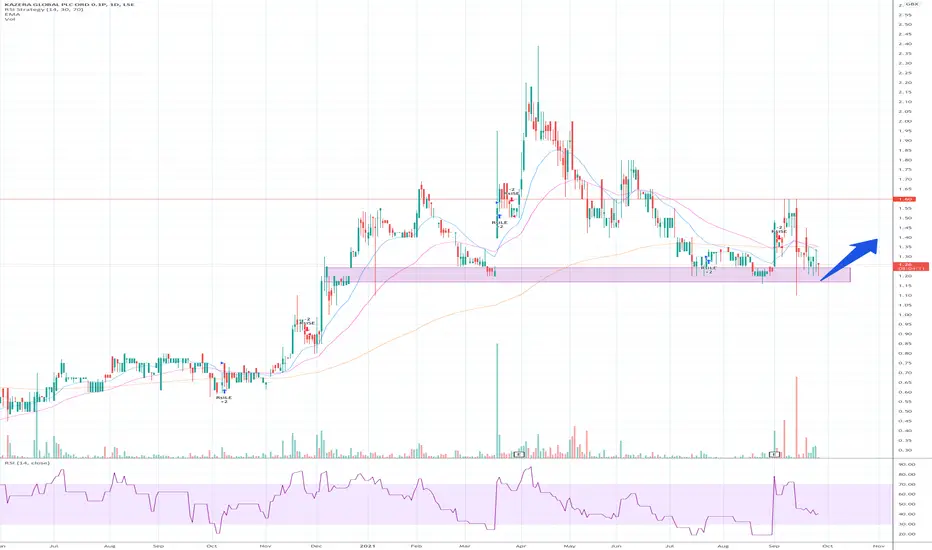
The current price of KZG.GB is 1.6000 GBX — it has increased by 3.23% in the past 24 hours. Watch KAZERA GLOBAL PLC stock price performance more closely on the chart.
Depending on the exchange, the stock ticker may vary. For instance, on AQUIS exchange KAZERA GLOBAL PLC stocks are traded under the ticker KZG.GB.
KZG.GB stock has fallen by −4.41% compared to the previous week, the month change is a −24.17% fall, over the last year KAZERA GLOBAL PLC has showed a 190.91% increase.
KZG.GB reached its all-time high on Mar 12, 2018 with the price of 4.6300 GBX, and its all-time low was 0.1810 GBX and was reached on Mar 20, 2020. View more price dynamics on KZG.GB chart.
See other stocks reaching their highest and lowest prices.
See other stocks reaching their highest and lowest prices.
KZG.GB stock is 3.13% volatile and has beta coefficient of −0.30. Track KAZERA GLOBAL PLC stock price on the chart and check out the list of the most volatile stocks — is KAZERA GLOBAL PLC there?
Today KAZERA GLOBAL PLC has the market capitalization of 16.23 M, it has decreased by −1.50% over the last week.
Yes, you can track KAZERA GLOBAL PLC financials in yearly and quarterly reports right on TradingView.
KAZERA GLOBAL PLC is going to release the next earnings report on Mar 26, 2026. Keep track of upcoming events with our Earnings Calendar.
KZG.GB net income for the last half-year is −493.00 K GBP, while the previous report showed −1.60 M GBP of net income which accounts for 69.19% change. Track more KAZERA GLOBAL PLC financial stats to get the full picture.
No, KZG.GB doesn't pay any dividends to its shareholders. But don't worry, we've prepared a list of high-dividend stocks for you.
EBITDA measures a company's operating performance, its growth signifies an improvement in the efficiency of a company. KAZERA GLOBAL PLC EBITDA is −3.29 M GBP, and current EBITDA margin is −54.03 K%. See more stats in KAZERA GLOBAL PLC financial statements.
Like other stocks, KZG.GB shares are traded on stock exchanges, e.g. Nasdaq, Nyse, Euronext, and the easiest way to buy them is through an online stock broker. To do this, you need to open an account and follow a broker's procedures, then start trading. You can trade KAZERA GLOBAL PLC stock right from TradingView charts — choose your broker and connect to your account.
Investing in stocks requires a comprehensive research: you should carefully study all the available data, e.g. company's financials, related news, and its technical analysis. So KAZERA GLOBAL PLC technincal analysis shows the sell today, and its 1 week rating is neutral. Since market conditions are prone to changes, it's worth looking a bit further into the future — according to the 1 month rating KAZERA GLOBAL PLC stock shows the buy signal. See more of KAZERA GLOBAL PLC technicals for a more comprehensive analysis.
If you're still not sure, try looking for inspiration in our curated watchlists.
If you're still not sure, try looking for inspiration in our curated watchlists.