−0.004 GBP
−2.63 M GBP
0.00 GBP
278.54 M
About OROSUR MINING INC
Sector
Industry
CEO
Bradley William George
Website
Headquarters
Toronto
Founded
1989
FIGI
BBG000QP9WG8
Orosur Mining, Inc. engages in the business of identifying and advancing mineral projects. It operates through the following geographical segments: Brazil, Argentina, Colombia, and Canada. The company was founded on April 30, 1989 and is headquartered in Toronto, Canada.
OMI burst out of a triangle in an ascending channelOMI burst out of a triangle in an ascending channel
no advice
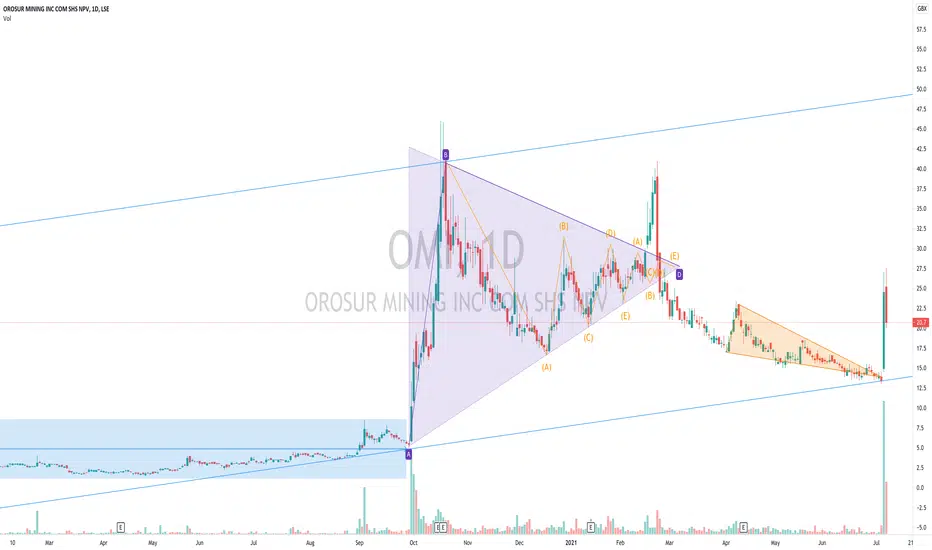
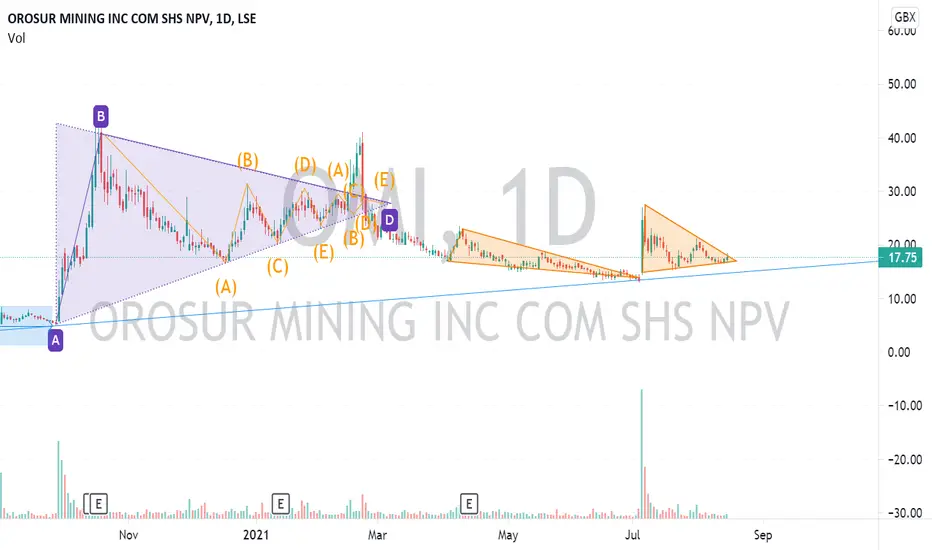
OMI (mining) upward ascending channel Huge triangle with converging waves in ascending channel - idea is this converges, the coiled spring releases and an upside trend kicks in

#OMI #OrosurMining - Technical retrace in progressSaw some noise about this being an exciting company, so though I'd check the technicals out.
For starters, what goes up very fast is often overdone and needs to cool before the next leg. It tried to bounce near the 50% mark but this fizzed out, meaning an ABC correction (Wave 2) is still ongoing.

Cup/Handle - will flyJust consolidating this latest rise. Familiar cup/handl shape on trendline support. Extension up at 15p look like a strong buy to me !

OMI 30%Indexes Gold.
Both have double bottoms in play.
Gold $1350 should move OMI back to at least 22.5p

OMIOMI Gold Producer. Stock geared directly to the Gold price.
Long on Gold = long on OMI.
Slightly under-Indexing the Gold rise at the moment so likel to be a decent entry level.

See all ideas
Summarizing what the indicators are suggesting.
Oscillators
Neutral
SellBuy
Strong sellStrong buy
Strong sellSellNeutralBuyStrong buy
Oscillators
Neutral
SellBuy
Strong sellStrong buy
Strong sellSellNeutralBuyStrong buy
Summary
Neutral
SellBuy
Strong sellStrong buy
Strong sellSellNeutralBuyStrong buy
Summary
Neutral
SellBuy
Strong sellStrong buy
Strong sellSellNeutralBuyStrong buy
Summary
Neutral
SellBuy
Strong sellStrong buy
Strong sellSellNeutralBuyStrong buy
Moving Averages
Neutral
SellBuy
Strong sellStrong buy
Strong sellSellNeutralBuyStrong buy
Moving Averages
Neutral
SellBuy
Strong sellStrong buy
Strong sellSellNeutralBuyStrong buy
Displays a symbol's price movements over previous years to identify recurring trends.
Related stocks
Frequently Asked Questions
The current price of OMI.GB is 8.996 GBX — it has increased by 4.53% in the past 24 hours. Watch OROSUR MINING INC stock price performance more closely on the chart.
Depending on the exchange, the stock ticker may vary. For instance, on AQUIS exchange OROSUR MINING INC stocks are traded under the ticker OMI.GB.
OMI.GB stock has risen by 12.87% compared to the previous week, the month change is a −14.73% fall, over the last year OROSUR MINING INC has showed a 123.56% increase.
OMI.GB reached its all-time high on Oct 19, 2020 with the price of 45.400 GBX, and its all-time low was 1.500 GBX and was reached on Apr 28, 2020. View more price dynamics on OMI.GB chart.
See other stocks reaching their highest and lowest prices.
See other stocks reaching their highest and lowest prices.
OMI.GB stock is 4.34% volatile and has beta coefficient of −0.59. Track OROSUR MINING INC stock price on the chart and check out the list of the most volatile stocks — is OROSUR MINING INC there?
Today OROSUR MINING INC has the market capitalization of 26.20 M, it has decreased by −13.79% over the last week.
Yes, you can track OROSUR MINING INC financials in yearly and quarterly reports right on TradingView.
OMI.GB net income for the last quarter is −609.44 K GBP, while the quarter before that showed 1.66 M GBP of net income which accounts for −136.79% change. Track more OROSUR MINING INC financial stats to get the full picture.
No, OMI.GB doesn't pay any dividends to its shareholders. But don't worry, we've prepared a list of high-dividend stocks for you.
Like other stocks, OMI.GB shares are traded on stock exchanges, e.g. Nasdaq, Nyse, Euronext, and the easiest way to buy them is through an online stock broker. To do this, you need to open an account and follow a broker's procedures, then start trading. You can trade OROSUR MINING INC stock right from TradingView charts — choose your broker and connect to your account.
Investing in stocks requires a comprehensive research: you should carefully study all the available data, e.g. company's financials, related news, and its technical analysis. So OROSUR MINING INC technincal analysis shows the neutral today, and its 1 week rating is neutral. Since market conditions are prone to changes, it's worth looking a bit further into the future — according to the 1 month rating OROSUR MINING INC stock shows the buy signal. See more of OROSUR MINING INC technicals for a more comprehensive analysis.
If you're still not sure, try looking for inspiration in our curated watchlists.
If you're still not sure, try looking for inspiration in our curated watchlists.