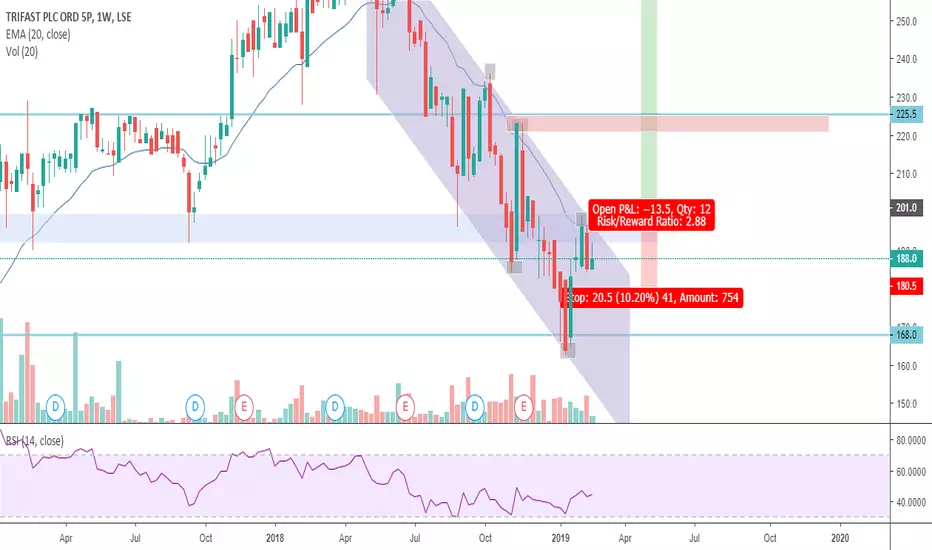
Trifast Plc Share Price Analysis - NeutralPossible long if the price moves above 200 mark and above the 200 day moving average too.
It could then test the 220 area. It it breaks past this is could test 260 area.
Still need to see higher highs and lower lows on the daily chart to generate a bullish bias.
For a good risk/reward once it bre
Next report date
—
Report period
—
EPS estimate
—
Revenue estimate
—
−0.03 GBP
−4.44 M GBP
233.67 M GBP
111.21 M
About TRIFAST ORD GBP0.05
Sector
Industry
CEO
Iain Philip Percival
Website
Headquarters
Uckfield
Founded
1985
ISIN
GB0008883927
FIGI
BBG000DQNP24
Trifast Plc engages in the provision of manufacture and trade of industrial fasteners. It operates through the following geographical segments: UK and Ireland, Europe, North America, and Asia. The company was founded in 1973 and is headquartered in Uckfield, the United Kingdom.
Related stocks
Summarizing what the indicators are suggesting.
Neutral
SellBuy
Strong sellStrong buy
Strong sellSellNeutralBuyStrong buy
Neutral
SellBuy
Strong sellStrong buy
Strong sellSellNeutralBuyStrong buy
Neutral
SellBuy
Strong sellStrong buy
Strong sellSellNeutralBuyStrong buy
An aggregate view of professional's ratings.
Neutral
SellBuy
Strong sellStrong buy
Strong sellSellNeutralBuyStrong buy
Neutral
SellBuy
Strong sellStrong buy
Strong sellSellNeutralBuyStrong buy
Neutral
SellBuy
Strong sellStrong buy
Strong sellSellNeutralBuyStrong buy
Displays a symbol's price movements over previous years to identify recurring trends.
Frequently Asked Questions
The current price of TRI.GB is 65.62 GBX — it has increased by 0.20% in the past 24 hours. Watch TRIFAST stock price performance more closely on the chart.
Depending on the exchange, the stock ticker may vary. For instance, on AQUIS exchange TRIFAST stocks are traded under the ticker TRI.GB.
TRI.GB stock has fallen by −2.48% compared to the previous week, the month change is a −4.90% fall, over the last year TRIFAST has showed a −8.10% decrease.
We've gathered analysts' opinions on TRIFAST future price: according to them, TRI.GB price has a max estimate of 140.00 GBX and a min estimate of 100.00 GBX. Watch TRI.GB chart and read a more detailed TRIFAST stock forecast: see what analysts think of TRIFAST and suggest that you do with its stocks.
TRI.GB reached its all-time high on Apr 25, 2018 with the price of 276.25 GBX, and its all-time low was 48.18 GBX and was reached on Feb 20, 2023. View more price dynamics on TRI.GB chart.
See other stocks reaching their highest and lowest prices.
See other stocks reaching their highest and lowest prices.
TRI.GB stock is 0.20% volatile and has beta coefficient of 0.50. Track TRIFAST stock price on the chart and check out the list of the most volatile stocks — is TRIFAST there?
Today TRIFAST has the market capitalization of 84.41 M, it has decreased by −2.18% over the last week.
Yes, you can track TRIFAST financials in yearly and quarterly reports right on TradingView.
TRIFAST is going to release the next earnings report on Jun 20, 2025. Keep track of upcoming events with our Earnings Calendar.
TRI.GB net income for the last half-year is 1.34 M GBP, while the previous report showed −6.00 M GBP of net income which accounts for 122.39% change. Track more TRIFAST financial stats to get the full picture.
As of Jun 20, 2025, the company has 1.2 K employees. See our rating of the largest employees — is TRIFAST on this list?
EBITDA measures a company's operating performance, its growth signifies an improvement in the efficiency of a company. TRIFAST EBITDA is 18.57 M GBP, and current EBITDA margin is 7.95%. See more stats in TRIFAST financial statements.
Like other stocks, TRI.GB shares are traded on stock exchanges, e.g. Nasdaq, Nyse, Euronext, and the easiest way to buy them is through an online stock broker. To do this, you need to open an account and follow a broker's procedures, then start trading. You can trade TRIFAST stock right from TradingView charts — choose your broker and connect to your account.
Investing in stocks requires a comprehensive research: you should carefully study all the available data, e.g. company's financials, related news, and its technical analysis. So TRIFAST technincal analysis shows the sell today, and its 1 week rating is strong sell. Since market conditions are prone to changes, it's worth looking a bit further into the future — according to the 1 month rating TRIFAST stock shows the sell signal. See more of TRIFAST technicals for a more comprehensive analysis.
If you're still not sure, try looking for inspiration in our curated watchlists.
If you're still not sure, try looking for inspiration in our curated watchlists.