ArbusdtBreaking two downtrend here
Obv bullish breaking out volume profile also
Mid term targets shown
ARBUSDT.PS trade ideas

ARBThe price has formed an ascending channel and is attempting to break above the middle line. A successful break above the middle line would potentially propel the price towards the upper boundary of the channel. On the other hand, a break below the lower boundary could lead to a sideways movement or initiate a local downward trend towards the $1 zone.

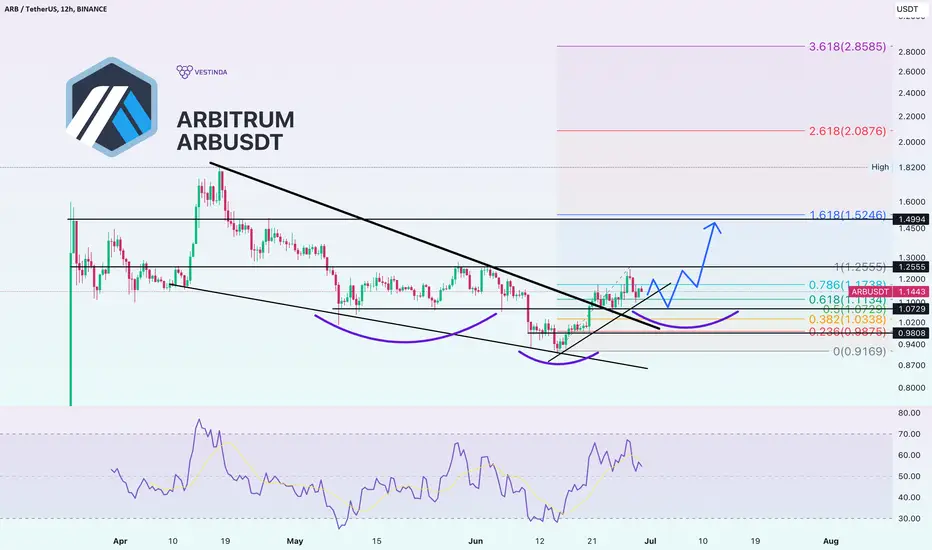
Arbitrum ARBUSDT Price Analysis (12h)Upon careful analysis, it is evident that ARBUSDT is displaying the formation of inverted head and shoulders pattern. This pattern consists of three distinct parts: the left shoulder, the head, and the right shoulder. The neckline, which acts as a crucial level of support or resistance, connects the lows of the pattern.
Rebound Potential:
Based on the formation of the inverted head and shoulders pattern, we can anticipate another rebound in the price of ARBUSDT. The pattern indicates that the price may closely approach the $1.07 support zone before making its way up. This rebound could potentially lead ARBUSDT towards the $1.25-1.50 zone, which aligns with significant resistance levels observed in late April.
Supporting Factors:
Several factors further support the likelihood of a rebound in ARBUSDT. Firstly, the formation of an inverted head and shoulders pattern is considered a reliable bullish reversal pattern in technical analysis. Secondly, the convergence of the support zone and the historical resistance levels adds strength to the potential upward movement.
ARB Short | Breakdown incomingARB Short | Breakdown incoming
| Targets On Chart
Not an overly complicated set up, challenging the 50EMA with a breakdown on the RVOI trendline and an ascending channel.

ARB next move ARB moving in a rising channel and a break down from the small range here is my trade setup with proper liquidity stop loss

Arbitrum $ARB to 1.60$ ?👑 #ARB/USDT BUY 👑
Entry:
1.1307✅
Targets:
1️⃣1.2568🎯
2️⃣1.3595🎯
3️⃣1.4622🎯
4️⃣1.6084🎯

ARB/USDT: Past Prediction Correct, Next Bull Run Target $10
Sure, here is the technical analysis of ARB/USDT in a more professional report format:
Current Price: $1.20
Previous Analysis: In a previous analysis, CryptoPatel predicted that ARB/USDT would dump from $1.50 to $0.90. This prediction was correct.
Current Resistance Level: $1.25
Expected Price Movement: CryptoPatel expects ARB/USDT to break the $1.25 resistance level and test the $1.43 resistance level. However, they also expect ARB/USDT to be rejected from the $1.43 level and fall back to the $0.7-$0.5 range. This range would be a good accumulation zone for long-term investors.
Next Bull Run: CryptoPatel expects ARB/USDT to reach a minimum of $10 in the next bull run.
Key Support and Resistance Levels:
Support: $1.07/$0.77
Resistance: $1.25/$1.43
Overall Outlook: CryptoPatel believes that ARB/USDT is currently in a downtrend and is expected to continue to fall in the short term. However, they also believe that ARB/USDT is a good long-term investment and could reach a minimum of $10 in the next bull run.
Follow us for more Quality analysis Chart.

Arbitrum longArbitrum bounced off the support level. Asset broke trough off the descending trendline. Bullish movement to resistance level at 1.4822 is possible.

ARB Cup & Handle trend revesal RB is reversing its downward trend, as confirmed by a Cup & Handle pattern.
Entering a position here provides a risk-reward ratio of 5.55:1.

ARBUSDTThis is my opinion with technical analysis
Please respect the following rules:
1- Risk management .
2. Have your own strategy.

Finally Arb Showing Strength Seems :Like ready For Bullish impulse Falling Wedge Breakout & Retest Has Already Done expecting 50 to 55% Bullish Wave In Midterm

ARB/USDT Here is the $ARB/USDT chart marked with all the resistance and key levels for you to trade ..
Longing From Support or Key Level && Shorting From The Resistance Is Always The Key

ARB/USDT - inside the bearish channelHey traders 👋
New week is near so let's get ready for it by starting out with ARB coin here! We see clearly that nice bearish channel where it is forming "lower highs" here. We are looking for that channel to work our for the next few days where afterwards we would like to see a nice breakout or breakdown!
If you like ideas provided by our team you can show us your support by liking and commenting.
Yours Sincerely,
Swallow Team
Disclamer:
We are not financial advisors. The content that we share on this website are for educational purposes and are our own personal opinions.

ARB ngày 25/5ARB on June 25 is trending up and forming a bullish name pattern. Expected trend to complete a bullish spring roll pattern over the next few days before the change

Arb!!!!!!This is my edge in the market, where ever whenever I see it I go for it so a pump is expected so let see how it goes from here


$ARBIt is weekend and alts tend to run in weekend, if bitcoin dominance I expect this one to sour to 1.35$ after it reclaimed the range low at 1.1$

a good stop huntso many trader are in trap
it is a good stop hunt and when price recive to there level we hav a lot of buy position and we can use it and get a buy position

ARB/USDT ARB has formed a shift in market structure on the HTF. Lets see how our long is going to play out.

✴️ Arbitrum | There Is A Problem...This is a new Altcoin project so the chart is new as well. All I do is read charts and share with you my understanding of what I see.
When the chart is too young, not enough data, any analysis becomes weak.
With that said, we can still proceed.
The analysis is based on the short-term due to the lack of long-term information.
Things can change fast when considering the short-term.
Arbitrum hit a low in 15-June forming a cup pattern (yellow). This is our low support.
There is another low 8-May which is marked here with a blue space/line. The fact that ARBUSDT is trading above these levels, gives it bullish potential.
We can also see it trading above EMA10 and EMA21 while the RSI is above 50, this is all positive and opens the door for additional growth.
Then, while above $1.00 (8-May low), EMA10 and bullish RSI, we can expect additional growth. If this changes the bullish bias is lost.
Now that we looked at the signals and defined the risk, we can look at the targets and these are mapped on the chart.
$1.46 and $2.38. These are easy for this pair.
Remember to do your own research and planning.
Thank you for reading.
Namaste.

Arbitrum longArbitrum broke trough the resistance level. Asset broke trough the descending trendline. Bullish movement to resistance level at 1.43 is possible.

Arbitrum ARB price near the critical point, where to next?The price of ARBUSDT has reached a critical point: the crossing of the local trend line and the beginning of a strong liquidity zone.
In the price range of $1.12-1.27, longs have been taken twice in recent months with the hope of a strong "hype" growth in the price of Arbitrum, but it did not work out.
So we assume that it will not be possible to break above $1.27 at the first time, as many ARB holders will sell their investments at "break-even", as human psychology is so organized.
On the other hand, a lot of ARBs were distributed to cryptocurrency community members "for free," so why sell them, let them stay in the investment portfolio, maybe they will grow someday)
After the ARBUSD price stabilizes above $1.27, you can try to take a long +20% to $1.55
_____________________
Did you like our analysis? Leave a comment, like, and follow to get more

🔥 Arbitrum: Falling Wedge Waiting For Break OutARB has been trading bearish for the better part of three months now. During this period, a falling wedge pattern has emerged on the chart; lower-lows and lower-highs.
In my view, it's likely that ARB will continue to trade within this pattern for the foreseeable future. Keep in mind that we've got a FOMC interest meeting tonight which could cause some strong volatility.
Personally, I'd expect ARB to go lower in the near future and consolidate within the outer point of the pattern. Classically, falling wedges are bullish reversal patterns, so a bullish break out could lead to some decent gains, will make a new analysis once were there.
For now, keep an eye on this pattern in anticipation of a break out in the coming weeks.
