ARB/USDT POTENTIAL FALLING WEDGE! MUST BOUNCE FROM HERE!!Hey everyone! If you enjoy this content, please consider giving it a thumbs up and following for more analysis.
ARB showing potential on the daily timeframe! We might see a good bounce from here. Buy some here and add more in the dip.
Taregts:- $1.01/$1.24/$1.58/$1.86/$2.28
SL:- Daily close below $0.84
Let me know your thoughts in the comment section.
ARBUSDT trade ideas

Alt coin beatingAlt coins are highly speculative assets, please buy and sell with caution.
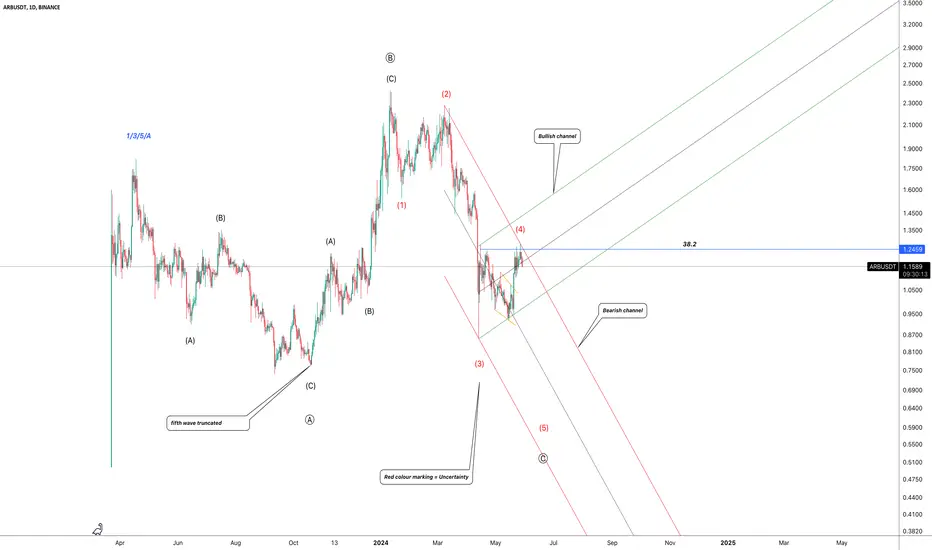
I do like Arbitrum, it’s a top Layer 2 project and should benefit from the upcoming Eth etf. However, the chart looks very bearish and it could continue to drop to $0.75. If that level is lost, I’d be exiting my position and wait for it to stop bleeding.
We appear to be in wave C of the abc correction, so I suspect a turnaround could be on the horizon. But let’s not fight the trend, which continues to the downside. An early indication of a change in market structure is we can climb rhe 0.5 Fibonacci Speed fan (green line). I’ll be watching this closely, slowly accumulating spot position when the time is right.
Not financial advice, just a trade idea.

ARB update, Daily Chart Hello
I want to make it simpler for those traders who are not sure about this symbol.
If ARB drops down along side this red boundaries, we can see last bearish fifth wave , but if ARB wants to reverse, so it should break out green channel with strong movements.
Just sit and see for now
Thanks
ARB - Update before CPIThis is an update to our previous post:
In this post I want to focus on the lower timeframe (2H). We are seeing a slight bullish divergence forming (series of lower lows in price followed by a series of higher highs on the RSI).
Therefore it looks like there is still strong buying interest around these levels. What we want to watch for now is continued daily closes above the white line in my previous post solidifying that as new support.

ARB - LongWarning: Do not enter the position without trigger and confirmation and trading setup.
After the sharp correction and based on the harmonic patterns, SMC and SK analysis ARB is ready for incoming strong impending bullish wave.
Don't risk it, please don't forget stop loss, when we reach the first target, save some profit and then change the stop to entry.

#ARB/USDT#ARB
The price is moving within a bullish channel pattern on a 12-hour frame, which is a retracement pattern
We have a bounce from a green support area at 0.9000
We have a tendency to stabilize above the Moving Average 100
We have a downtrend on the RSI indicator that supports the rise and gives greater momentum
Entry price is 0.9700
The first target is 1.048
The second goal is 1.136
Third goal 1.24

Arbitrum | ARB What Is Arbitrum and Why Is It a Big Deal ?
The price of Arbitrum is $1.40 today with a 24hour trading volume of 1 billion dollar. This represents a 2.7% price increase in the last 24 hours and a 4% price increase in the past 7 days
Arbitrum is a rollup chain designed to improve the scalability of Ethereum. It achieves this by bundling multiple transactions into a single transaction, thereby reducing the load on the Ethereum network.
a rollup chain is a layer 2 solution that aggregates and processes transactions off-chain, before submitting a single transaction to the Ethereum mainnet. This means that users can enjoy faster and cheaper transactions, while still benefiting from the security and decentralization of the Ethereum network.Arbitrum's native token is called the Arbitrum token, or ARB for short. The token is used to pay for transaction fees on the Arbitrum network and also serves as a means of governance for the protocol. Holders of ARB can participate in decision-making processes, such as proposing and voting on protocol upgrades or changes.
Smart Money Accumulating ARB !
The ARB airdrop, as expected culminated in a sell-the-news narrative, with token holders cashing out in large numbers. However, the token’s fundamentals have not faltered amid an influx of funds from institutions and other large-volume buyers – smart money. Following the announcement of the airdrop on March 16, tokens within the Arbitrum ecosystem exploded including Magic (MAGIC), GMX (GMX) Radiant Network (RDNT), and Gains Network (GNS).
ARB has launched into an ecosystem with strong fundamentals, which are likely to cool off the token’s downside in the coming weeks. Moreover, accumulation among investors, taking advantage of the dump after the airdrop could provide the necessary momentum for ARB to rally again.
next targets are 1.45 and 1.5$

ARB spotAMEX:ARB taking support from 0.92$ and failed to break it. It’s a good chance for a pump if it breaks the trendline.
Keep an eye on it

ARBITRUM TOOK A TOTAL TURN $0.75 BE IT NEXT RESTING PLACE
After that huge sink I am convinced that we are in some kind of range for BINANCE:ARBUSDT and the sink will continue till mid May. Looks like winter came in to early.
OTHER ANALYSIS

ARBUSDT 1DFalling wedge formation on the #ARB daily chart. It is in its support zone. Expect a bullish move from here. In case of a breakout, the targets are:
$1.2477
$1.4903
$1.6864
$1.8825
$2.1616
$2.5172

Trade 8 (6/1) Very good coin to make a bet.(6/1) Means, in this profile for the past 7 trades, 6 were successful, and 1 were wrong.
In this case there are two important supports (black lines) and the 1,618 fibonacci extension was acomplished.

ARB - Ranges overview Here is a quick look at the current ranges on ARB.
We are currently trading around the lows of the HTF range. Not much action as BTC is currently accumulating and setting up for its next move.
Will be looking to see IF we trade through the sellside liquidity resting around 0.8452$. IF we do and hold expect to trade towards 1.2776$ and eventually 1.5675$.
IF we break through the sellside and get a clean below expect further pa to the downside.
For the traders who also invest amongst you guys...these levels could be interesting for long term holds entries.
No need to front run the market...BE PATIENT AND WAIT FOR IT TO COME TO YOU.
Stay safe and never risk more than 1-5% of your capital per trade. The following analysis is merely a price action based analysis and does not constitute financial advice in any form.

ARB - Maintaining TrendWith the liquidation hunt we can see ARB is still respecting its trend. Wicked slightly below our lower white trendline, but has continued to hold most of the candle bodies above that level. If this level continues to hold with daily candles we will see a retest of the yellow trendline.
Once the yellow trendline is broken and flipped back into new support that is when we can expect a momentum move for ARB.

Buy setup on arbusdtThe price will continue down till the
pd.rarry on 4H( rejection block,mitigation block, CSD block)
On the same way on daily the area is csd block,
+the price took the dol on the top and make retracement on daily and 4h time frim
We will wait a confirmation on 15 min
And 1h
The target is the liquidity above the top (2.5)

Arbitrum Rectangle + Elliott Wave: Targets $1.6 or $1.93TL;DR Potential local bottom at $1.07, potential targets at $1.6 and $1.93
Arbitrum is still trading in its rectangle.
After a recent rejection from the resistance, today it retested $1.07.
If it holds, it would mark a perfect Wave 2 end (61.8% of Wave 1).
In turn, according to Elliott wave theory, this would set the Wave 3 target to $1.6 or $1.93.
🎯 $1.6 is also the rectangle breakout target, and a High Volume Node (HVN), so lots of confluence there.
I see two potential strategies for a long entry:
The safe play would be to wait for a daily close above the resistance trendline, targeting W3 targets 1 and 2.
The higher risk/reward play would be entering now, with a somewhat tight SL below $1.07, targeting the rectangle resistance first, then W3 targets 1 and 2.
In both cases, watch the $1.45 area because it is a previous support and HVN.
➡️Not Financial Advice⬅️

ARB/USDT 4HWhen the price reaches the gray level, we can expect demand from the price. As a result, when the price reaches the gray level, we can look for a buy position.
Our preference is the orange level, which you can use if you wish
Target: 1.35
Gray level: 0.9639_1.0285
Orange level: 0.9668_0.9926
Entry without confirmation is not allowed

Lingrid | ARBUSDT ready to TAKE OFF ?After a strong bullish impulse movement, the BINANCE:ARBUSDT has been stuck in a prolonged consolidation phase. Currently, the market is trading within this consolidation zone, having broken above the crucial level of 1.1000. As the price approaches the support level, it's likely to bounce off and resume its upward momentum. The market has been in an accumulation phase since April, with a minor pullback expected to support the level before the price extends its upward trajectory, targeting higher resistance levels. My goal is the resistance at 1.3300
Traders, if you liked this idea or if you have your own opinion about it, write in the comments. I will be glad 👩💻

Keep an eye on the #ARB/USDT Diagonal Trendline in 1-Hour TF!Keep an eye on the #ARB/USDT Diagonal Trendline in 1-Hour TF!
Wait for a successful breakout and retest to open a long position in $ARB. The local resistance level is PWH $1.26.

ARB/USDT upward momentum descending resistance breakout ahead?💎 Paradisers! Keep an eye on #ARBUSDT as it displays strong indications of a bullish continuation from the demand zone after a breakout from descending resistance.
💎 Our meticulous analysis of the price action reveals that $ARBITRUM is poised to breach descending resistance. Should it successfully do so and sustain momentum above the EMA 100, we anticipate a robust bullish advance targeting the next supply area.
💎 The bullish journey is expected to commence once the price clears the supply area and maintains its momentum. However, it’s critical to prepare for other possibilities: if AMEX:ARB fails to surpass the descending resistance and starts to decline, we could see a bullish rebound from a lower support zone. Yet, a drop below this zone could negate the bullish outlook, potentially leading to further price drops.
MyCryptoParadise
iFeel the success🌴

Fake Bull FlagNever trade Bull Flag in Premium market! is Fake........................................................................

ARB/USDT Trading ScenarioWe are considering a scenario of price movement for ARB.
Currently, the asset is within a price range that attracts active market participants' interest. This interest is confirmed by the analysis of the volume profile and increased activity on the vertical histogram.
The asset's price is currently below the resistance level at $1.2746, which is above the point of control at the price level of $1.1439, acting as support.
We can expect a continuation of the upward movement upon overcoming the resistance level at the price of $1.2746 and consolidating above it. The next significant point may be the overcoming of the 200-day moving average, above which the resistance level is at the price of $1.6051.

Arbitrum Bullish Idea Dear Traders,
I consider Arbitrum a good beta play for Ethereum. This is my idea of bullish continuation, respecting this ascending channel.
Cheers,

ARB Levels of InterestLocal resistance that we need to break 1.22 to 1.24
Local support that needs to hold 1.14 to 1.12
Failure to hold 1.14 to 1.12 level, then we might retest 1.07 to .98 area
Levels of Interest:
1.07 - 4H FVG (fair value gap)
1.04 to .98 - single prints & HVN (high volume node)
