Whats going with ARB?You seem to have hit a wall of orders on CEX. I hope you enjoyed that.
What do you think will happen next? ETH beta's season, ladies and gentlemen. I was wrong about CRYPTOCAP:ETH , but I was right about the asset beta theory.
At the moment CRYPTOCAP:BTC and CRYPTOCAP:ETH are in range and this may continue for some time, during which time a lot of liquidity will come into the alternative assets.
Why will this happen? Because only algorithms are able to trade successfully and stably in a range situation. Humans are too weak for that.
Traders will have to trade something and there is nothing better than assets that are linked to the largest ecosystems.
Place your bets ladies and gentlemen. Im already in game
What is BTC beta's???
ARBUSDT trade ideas

ARB Potential Pre Bull Run ABC CorrectionLooking at the 4hr chart for ARB and the entire history since lauch we can see the initial range formed was approximately 145%.
Currently price has pulled back into and retested the top of the range signaling the possiblity of a larger pullback before a "potential" bull run.
I emphasis the word potential as expectations are based on the 3year cycle. While this cycle has repeated it's self 3 times and likely will again it has long been said when even the shoe shine can predict the next bull run distribuition has run its course and the run never comes.
For now charts are up and to the right until they are not.
Current Trading Plan:
Wait for a potentially larger pull back to the 1.15-1.35 area at 50% of the current range. This would also be a pull back into the swing high to low golden pocket.
Being the market has already pushed up and likely in sideways accumulation if we are going to get another run the next lows should be last oppertunity for the best prices.
Typically as the market expands it grows eponentially which is the basis for the potential targets on the chart.
Trade Well....


ARBUSDT LongARBUSDT Long
Entry if bullish engalfing candle close above 1.9043
TP1 2.00
TP2 2.05
TP3 2.10
TP4 2.20
SL 1.7618
Leverage 5-10x


ARB Short-Term Bullish Reversal PotentialThe price retraced to the 1.88 level, which is the 0.618 fib area. If BTC bounces back from 41.5k, then we can take nearly 10% profit from the position.

ARB may continue to rise according to the double bottom structur🧠We started a correction at the daily level in accordance with the double-top short structure, and the correction has ended. Moreover, a double bottom bull structure has been formed in the buying zone, and there is also an expectation of rebound after sweeping the liquidity, so we will be able to continue to maintain the upward trend.📈
Let’s see 👀
🤜If you like my analysis, please like 💖and share it💬
💕 Follow me so you don't miss out on any signals and analyze 💯


ARB longArbitrum bounced off the lower boundary of an ascending channel. The bullish movement to the middle of the channel, which also matches the major resistance level at $1.91 is expected to happen.

ARB/USDT Keep an eye on the demand, Potential Bounce hard!!💎 ARB has witnessed significant developments in the market. After achieving a new all-time high (ATH), the price has experienced a significant decline, and there is a possibility that it will continue to drop until it reaches the demand area around the 1.37 area.
💎 Once it reaches this demand area, there is potential for a bounce, which could lead to a continuation of the upward movement and the probability of setting a new ATH.
💎 However, if ARB reaches the demand area and does not show a positive response, such as consolidating in that region, this could be a concerning sign.
💎 It suggests that there is potential for the price to break down below the demand area and continue its downward trajectory, possibly heading towards the next lower demand area or even reaching the key support area.

ARB .786 Liquidity grag!!!!!Simply pulling a range we are currently in with perfect confluence! Long from the lows to ride to the .786 round about 2.22 where 6.6 million dollars of short liquidation are setting at!

ARB ANALYSIS🔮 #ARB Analysis 💰💰
🌟🚀 #ARB is retesting its crucial support zone. Also it is trading above its support zone and 50 EMA works as a crucial support. If #ARB successfully retests and sustain above the support zone then it may leads to a rally towards $2.4353 📈📈
🔖Current Price --- $1.7889
🎯Target Price -----$2.4353
⁉️ What to do?
- We have marked some crucial levels in the chart. We can trade according to the chart and make some profits in #ARB . 🚀💸
🏷Remember, the crypto market is dynamic in nature and changes rapidly, so always use stop loss and take proper knowledge before investments.
#ARB #Cryptocurrency #DYOR

ARBUSDTBINANCE:ARBUSDT Short idea
for ARB I'm looking for this setup.
⛔"Daily crypto market analyses I provide are personal opinions & not financial advice. Trading carries risks, so do your own research & seek advisor's help. #DYOR
Don't forget to 🚀 and comment

Arbitrum ($ARB) - Ranging for now, demand sitting belowThis idea is that ARB will see ranging price action with significant swings over the coming days weeks. Reclaiming the equilibrium would be major, but not sure if we get that just yet.
If the range is lost, I see this heading toward $1.30
Some serious gains to be made even if it ranges for a little while. Overall structure is strong and bullish for a longer term outlook however.
Cheers

Update on $ARBUpdate on LSE:ARB
Perfect deviation below, I expect price action to follow the indicated price channel for the uptrend distribution.
We need 2-3 bounce at support level to move upwards

ARB/USDT Bullish continuation from demand ?🚀ARB Today Analysis💎 Get ready, Paradisers! #ARBUSDT is on the brink of what looks like a profitable leap, showing all the signs of picking up steam from its current demand zone.
💎 Diving into #ARBITRUM latest trends, it took a little dip below the demand level, nudging the market vibe towards the sell side. Yet, with the price brushing against buying liquidity around this key point, a bullish rebound from the deeper demand at $1.3823 seems on the horizon. If LSE:ARB can keep up the pace after hitting this mark, we're potentially looking at a climb towards the juicy supply zone at $2.4078.
💎 But let's not forget, the trading arena is all about staying one step ahead. Should our star player fail to keep the bullish energy alive from its lower stance, a further drop could be in the cards.

ArbitrumGood luck to everyone! This analysis is for educational purposes only and does not constitute financial advice. Conduct your own analysis before making trading decisions.

Ascending Trend LineIn ARB's daily timeframe, a critical support exists in the blue zone. Bullish patterns here could resume the main trend. If this support breaks, the next focus is the ascending trend line.
(All analyses will be updated)
This analysis is informational, not financial advice. Good luck!

ARB/USDT Accumulation ZoneTraders,
This area is a good accumulation
zone for this pair. Arbitrum is an
L2 that is becoming big in
in one of the most bullish narratives
in crypto which is gaming.

ARBUSDT_N40ARBUSDT
En: 0.382 and 0.27
Sl: 0 (1% of your balance)
Tp: 1
(Check the picture or tradingView for Numbers)
Cancel if Tp crossed without opening
#30Min_trade
#N40

ArbusdThinking thats as low as we push for now tbh..
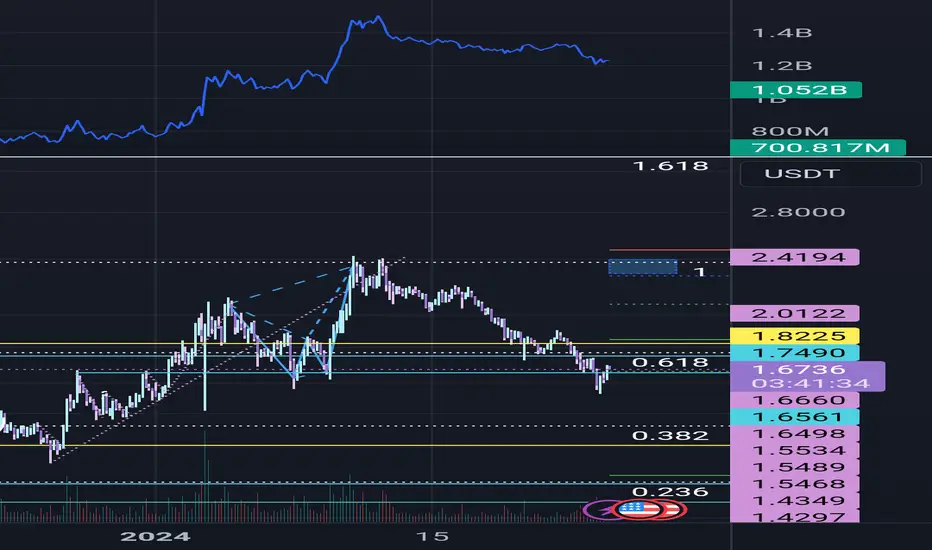
Bearish harmonic played till target 2
Would take some seriously bad news to push down to the last target..
short ARBArbitrum broke through the daily chart's ascending trendline and the support level. A decline to the support level at 1.26$ is expected to happen.

ARBThe possible movement of the ARB currency will continue
Probably, the correction has been completed here
