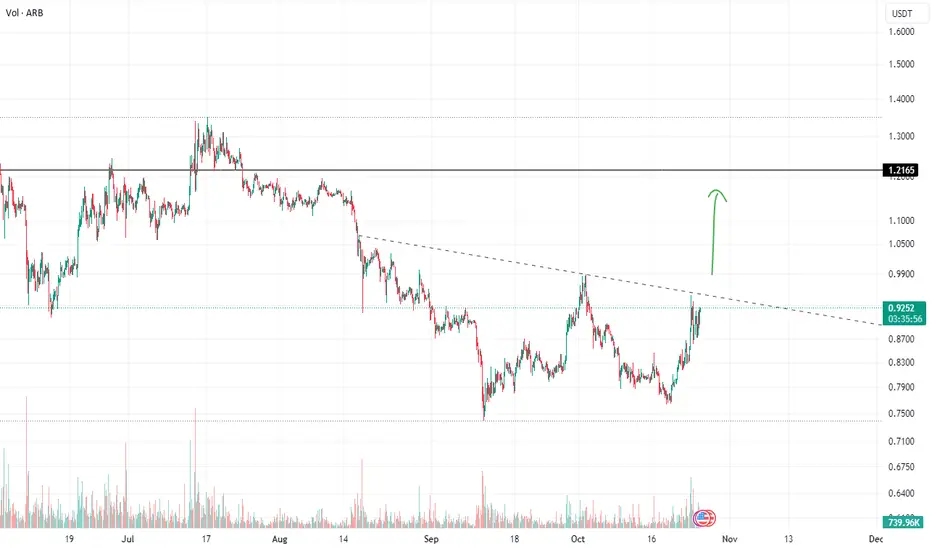
ARB Double bottom reversal in progressLooking at the chart its easy to spot. Blackrock confident in an ETF approval, lots of other alts looking similar, it's hard not to be bullish, but keep the feet on the ground for now.
ARBUSDT trade ideas

REVERSE ON $0.90We have explained to you the extremely important price levels and told you which areas are important with detailed explanations and indicator confirmations and price action confirmations.
So definitely from this analysis.

Fake break in CahnnelBy entering the support zone, you can witness a 20% rise
entry : 0.8106
Stoploss: 0.7788
TP1:0.8529
TP2:0.8973
TP3:0.9416
TP4:0.9898

ARB / XMR / ELON Same Candle But...These 3 coins printed similar long lower wicked candles and as described that is often a clue of bullish continuation.
But we can see very different continuations.
ARB and XMR have had a quiet pull back but ELON has had a wild dump.
This is an example of how crypto really is The Wild West.
And why it is important to be careful in the percentages of the coins chosen to build a portfolio.
At some point the high volatility of ELON will likely be expressed as a wild ripping rally and perhaps we'll even get a tweet from the great man himself 😅.
But obviously we dont want too much of a portfolio to be coins that behave like ELON🤨.
Not advice.

ARBUSDT
Chart pattern/Reversal formed on the weekly timeframe(double bottom)
neckline has been broken, looking forward for a pullback before finding bullish opportunity

ARBITRUM DOUBLE BOTTOMThis article is pure technical analysis. BINANCE:ARBUSDT is showing a double bottom pattern, indicating a potential bullish movement.
But first, pay attention to its past price movement that led to a bullish movement of the coin, ARB had a multi-month trendline breakout. Through this trendline below there were multiple instances of resistance (highlighted in red) from the all-time high.
As of this writing, the neckline is still showing its firmness as the price attempts to breakout after hitting it momentarily.
This firmness is presented on this chart below through back testing procedure wherein we see instances of it being most as resistance line and support at times.
For an intraday perspective, we have to wait for a confirmation for either breakout or breakdown plays.
If a breakdown happens, I plotted some trendlines for a possible take profit areas by using basic support and resistance with backtesting.
$1.0121 and $1.0619 will be my take profit areas to consider.
On the other hand, I plotted a diagonal trendline support, when a massive sell confirms potentially could lead to reversal.
Also, consider the MACD indicator in a 4-hour timeframe if MACD crosses along with weakening of the buying pressure that could lead to a reversal.
BULL or BEAR: Still BULLISH considering market on a consolidation phase from the massive pump that happened days ago. Let's give the market the time to recover :)
I'll give time to update the movement for this coin. Overall, scalp if you want to trade this coin and wait for those scenarios that I mentioned for intraday trade.
Follow me on this platform for more market pattern ideas like this. I appreciate the support.
Always PLAN your trades and happy trading!

ARB - Target 1.044 (25 OCT)Good luck to everyone! This analysis is for educational purposes only and does not constitute financial advice. Conduct your own analysis before making trading decisions.
Is it the Bullish Flag?Daily Chart
I spot the Bullish Flag or Falling Wedge on ARB's chart
Now, it's trading at 0.859x and moving up to resistance around $1
If it can break and close above this resistance that is huge profit for next bull cycle.
Wait for next move

ARB - Strong move over TP1 with potential upsideI like ARB testing TP1 and holding here. Might still come back to retest the trendline but overall it's in a great spot to start accumulation for future targets on the table.

ARBITRUM Long term plan #NFAARB/USDT HTF or long TERM full plan based upon monthly & weekly time frame #NFA #DYOR

ARB/USDTThe reason why I am bullish on AMEX:ARB hitting $1.60 is the falling wedge pattern breakout and target = $1.60 + we have formed a double bottom pattern and the target of the W pattern = $1.60
imo EOY AMEX:ARB can hit $1.60

ARB/USDT A Bullish Breakout on the Horizon? 👀 🚀 💎 Paradisers, ARBUSDT is on the cusp of a significant move, flirting with a resistance breakout that could pave the way for a bullish trajectory.
💎 Our observations have consistently shown Arbitrum adherence to a descending trendline, which it has now surpassed, indicating a bullish trend. Currently, it's challenging a resistance level at 1.0888, and a successful breach could lead to a surge towards higher resistance zones. The price's position above the EMA55 further bolsters the potential for an upward push.
💎 However, should ARBUSDT face a strong rejection at the 1.0888 mark, we might see it retreat to a support level at 0.8798 for a bullish resurgence.
💎 On the flip side, slipping below this support level could trigger a notable downtrend. Stay vigilant and ready to capitalize on the forthcoming market movements.

✴️ Arbitrum "W Pattern" | Easy 111% Potential GrowthThe "W Pattern" is a double-bottom pattern with a bent, it works the same way.
Here Arbitrum (ARBUSDT) can be seen recovering strong after hitting a new All-Time Low.
Volume slowly rising but the bullish action is ultra-strong.
This is very early... Well, not early, early but there is plenty of room left for additional growth.
Volume will go huge, big, off the chart soon, and we will have massive growth daily... Really big green candles.
👉 The targets on the chart are easy to hit. 111%+
The main bullish signal is the current price action, market cycle and ARBUSDT growing above EMA100, EMA50 and EMA10.
We only look up... Right now is very easy to predict what will happen next!
Namaste.

ARB (breakout retest)ARB / USDT
The coin just make breakout retest
As long as it hold above this giant channel it’s bullish
Best of wishes

ARB/USDTAMEX:ARB
ok we had a descending channel which then formed a head and shoulders pattern, the head and shoulders got invalidated as soon as price increased from left shoulder. Now we broke out of falling wedge and when you measure the breakout from inside wedge = $1.60

ARBThe price has crossed a trend line and a weekly resistance and is pulling back to this area. After that, I expect to move towards the $1.3 target and form a deep crab pattern, which will continue to correction to the area we are currently in, and then move towards=>ATH

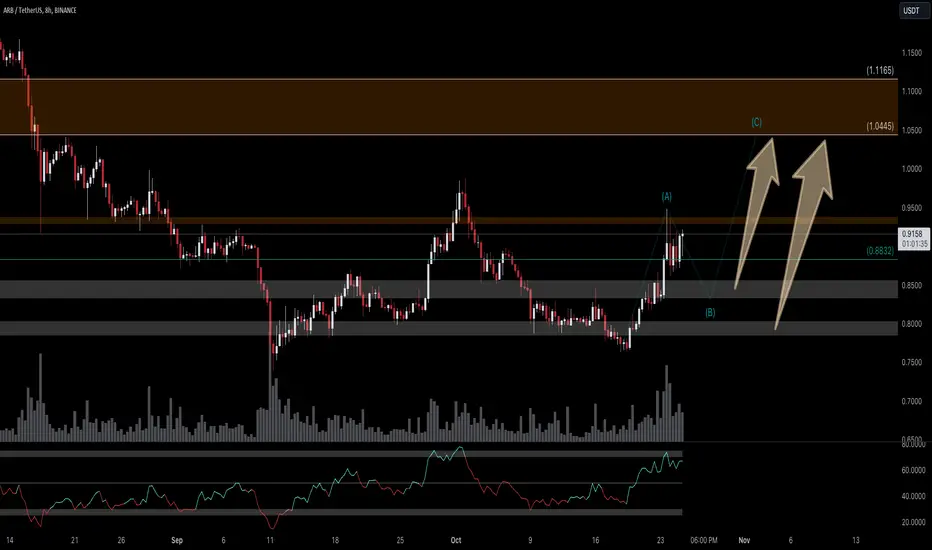
ARBUSDT Elliott Waves Analysis (Local Setup)Hello friends.
Please support my work by clicking the LIKE button👍(If you liked). Also i will appreciate for ur activity. Thank you!
Everything on the chart.
Entry: market and lower
Targets: 0.87 and 0.9
after first target reached move ur stop to breakeven
Stop: ~0.77 (depending of ur risk). ALWAYS follow ur RM .
RR: 1 to 2
risk is justified
Good luck everyone!
Follow me on TRADINGView, if you don't want to miss my next analysis or signals.
It's not financial advice.
Dont Forget, always make your own research before to trade my ideas!
Open to any questions and suggestions

ARBARB diamond pattern
Nothing much to say it's clear on chart
It's not a financial advise
Always DYOR

#ARB/USDT is testing PMH $0.9295 support level in 4-Hour TF!#ARB/USDT is testing PMH $0.9295 support level in 4-Hour TF!
AMEX:ARB needs to clear PWH $0.999 resistance level to gain the bullish momentum. Wait for BO/retest to open a long position.
Wait for PMH breakdown/retest to short it.


💡Trade Idea #ARB/USDT:W-Bottom on #Arbitrum is fully formed. Bullish on the breakout (if the candle closes above this resistance zone).