ARB - long as wellHi, ARB is trying to break up. If this will happen its hard to predict what will happen because there is not much history behind. If such a scenario will be in play, I would take profits arround 1.48$, however this coin is really hard to predict. Hard to predict means it can be pumped to 3-4$ even.
ARBUSDT trade ideas

Arbitrum Long term tradeBack at it again with another huge potential trade setup. This time it's Arbitrum the layer 2 scaling solution for Ethereum, designed to improve scalability and reduce transaction costs on the Ethereum network. While I cannot predict the future with certainty, I can provide you with some potential reasons why Arbitrum crypto token could experience significant growth and increase in value:
Scalability Solution: Ethereum has been facing scalability challenges due to its limited transaction throughput. Arbitrum aims to address this issue by providing a layer 2 solution that can process a high number of transactions off-chain, while still maintaining the security and decentralization of the Ethereum mainnet. If Arbitrum gains widespread adoption as a scaling solution, it could attract more users and projects to the Ethereum ecosystem, which could positively impact the value of the Arbitrum token.
Lower Transaction Costs: Ethereum's high transaction fees have been a concern for users, especially during periods of network congestion. By utilizing Arbitrum, users can benefit from lower transaction costs since most of the transactions are processed off-chain. This cost efficiency may incentivize more users and decentralized applications (dApps) to adopt and utilize the Arbitrum network, potentially driving up the demand for the token.
Arbitrum's impressive performance in terms of TVL, volume, and user metrics, despite being a relatively new token, demonstrates its strong adoption and growth potential. Despite launching only a few months ago, Arbitrum has managed to achieve metrics that has far exceeded Solana's.
In my trading analysis, I have identified an attractive opportunity with Arbitrum crypto token. My strategy focuses on high-reward, low-risk investments to maximize the probability of returns.
If price drops to 0.8$ i will buying a nice bag and riding it to these targets, potentially 70x for the next bull cycle. However, if the price does not reach $0.8 and the market structure appears bullish, I will adjust my approach. In such a scenario, I will employ a breakout strategy, carefully observing and buying on upward price breakouts.
It's important to note that this is a long-term play, and I anticipate holding my positions until 2024. I am confident in the prospects of Arbitrum as a new narrative in the crypto space, as old narratives die new ones like Arb are born.
By strategically selecting assets with higher betas but lower risks, I aim to achieve substantial returns while maintaining a calculated approach.
Don't forget to take profits when the time comes, buying at these prices could be life-changing, the upcoming weeks will be crucial.
As always stay blessed and drop a follow to read what other tokens I will be buying soon!


ARBUSDT Long idea"Daily crypto market analyses I provide are personal opinions & not financial advice. Trading carries risks, so do your own research & seek advisor's help."
Don't forget to like and comment

ARBUSDTARBUSDT has formed Head and Shoulder , a reversal pattern and also break the neckline as well. Will All these confluences put sell pressure on instrument?

ARBUSD ❕ declineThe RSI indicates that the initiative at the moment is on the side of the bears.
Price has broken down 50EMA on the 4H TF.
I believe the asset will continue to decline after fixing below the support level.

ARB S&R>>>>>>>>>imanff
ARB S&R >>>>>>>>>>>>
ARB / TetherUS (BINANCE:ARBUSDT) 1.1696 0.0630 5.69%
imanff
just now
14 min 5 sec left to edit idea
Trend Analysis Chart Patterns
just now
Hello EveryOne
I Have Tried My Best to Bring the best Possible outcome in this Chart.
Everything is cleared on the chart.
Colored line are important lvl for support,
Gray line are possibility's target for mid term.
It's just an analyze,
Not a financial advise.
PLZ DYOR
With hopping success>>>>>

QUICK SCALP ARBUSDTThe information I share on this platform is based on my personal opinion and experience, and should not be considered as financial advice. You are responsible for your own investment decisions and should always do your own research before making any trades. I do not guarantee the accuracy or validity of any data or analysis I provide. Please use your own judgement and caution when following any call or signal I post. #imo
NOTE:
25% PROFITS AT EVERRY FIBONACCI RETRACEMENT LEVEL.
USE ISOLATED (FOR CRYPTO EXCHANGE)
USE CAPITAL RATIO (5 - 10 % OF YOUR CAPITAL)
DONT FOMO (FEAR OF MISSING OUT)
If you want to trade crypto successfully, you need to follow some basic rules. One of them is to use isolated margin for your trades. This means that you only risk a fixed amount of your capital for each trade, and you don't borrow more than you can afford to lose. This way, you can avoid liquidation and protect your account balance.
Another rule is to trust the process. Trading is not a get-rich-quick scheme, but a long-term game that requires patience and discipline. You need to have a trading plan and stick to it, regardless of the market fluctuations. Don't let your emotions get the best of you and don't chase unrealistic profits.
A third rule is to use capital ratio for your trades. This means that you divide your capital by 10 and use only one-tenth of it for each trade. This will help you diversify your portfolio and reduce your risk exposure. You can also adjust your position size according to the market conditions and your risk appetite.
Finally, a fourth rule is to avoid FOMO (fear of missing out). This is a common psychological trap that makes traders enter or exit trades based on hype or panic, rather than logic or analysis. FOMO can lead to overtrading, poor decision making, and unnecessary losses. You need to be confident in your own strategy and not follow the crowd blindly.
By following these four rules, you can improve your chances of success in crypto trading and enjoy the benefits of capital ratio.

ARB Arbitrum Bullish Trendline ARB is currently displaying a bullish trend continuation pattern, indicating the potential for further upward movement in the near term. The price action suggests ongoing buying pressure and positive market sentiment, signaling the possibility of continued price appreciation.
Considering the bullish trend continuation, it is reasonable to set a price target of $1.20 for ARB. This target represents the projected upside that could be achieved if the bullish trend persists.
Looking forward to read your opinion about it!

long ARBAMEX:ARB broke through the descending trendline and the resistance level. Bullish movement to $1.24 is likely to happen.

ARBUSDT wants the breakout?ARBUSDT is currently testing a significant key resistance level at $1.2. This resistance level represents a price point where selling pressure has historically been observed and may act as a barrier to further upward movement.
According to Plancton's rules, a breakout above the $1.2 resistance level could present a potential opportunity for a new long position. A breakout occurs when the price moves decisively and sustains a move above the resistance level, indicating a potential shift in market sentiment and a higher probability of continued upward momentum.
However, it's important to consider the volume alongside the breakout. Increased trading volume is often seen as a confirmation of a breakout and can provide additional support for the upward movement. Higher volume suggests greater market participation and can increase the reliability of the breakout signal.
–––––
Follow the Shrimp 🦐
Keep in mind.
🟣 Purple structure -> Monthly structure.
🔴 Red structure -> Weekly structure.
🔵 Blue structure -> Daily structure.
🟡 Yellow structure -> 4h structure.
⚫️ Black structure -> <= 1h structure.
Follow the Shrimp 🦐

ArbusdtBreaking two downtrend here
Obv bullish breaking out volume profile also
Mid term targets shown

ARBThe price has formed an ascending channel and is attempting to break above the middle line. A successful break above the middle line would potentially propel the price towards the upper boundary of the channel. On the other hand, a break below the lower boundary could lead to a sideways movement or initiate a local downward trend towards the $1 zone.

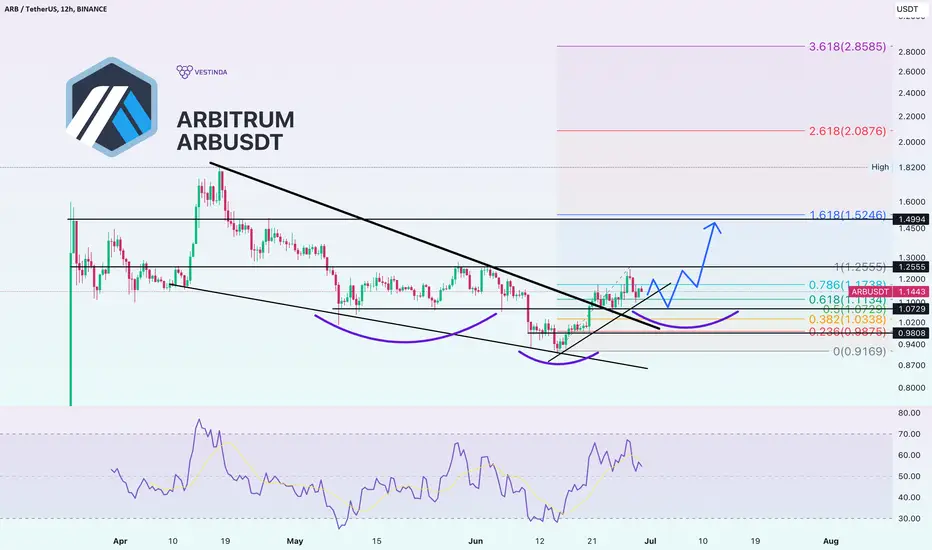
Arbitrum ARBUSDT Price Analysis (12h)Upon careful analysis, it is evident that ARBUSDT is displaying the formation of inverted head and shoulders pattern. This pattern consists of three distinct parts: the left shoulder, the head, and the right shoulder. The neckline, which acts as a crucial level of support or resistance, connects the lows of the pattern.
Rebound Potential:
Based on the formation of the inverted head and shoulders pattern, we can anticipate another rebound in the price of ARBUSDT. The pattern indicates that the price may closely approach the $1.07 support zone before making its way up. This rebound could potentially lead ARBUSDT towards the $1.25-1.50 zone, which aligns with significant resistance levels observed in late April.
Supporting Factors:
Several factors further support the likelihood of a rebound in ARBUSDT. Firstly, the formation of an inverted head and shoulders pattern is considered a reliable bullish reversal pattern in technical analysis. Secondly, the convergence of the support zone and the historical resistance levels adds strength to the potential upward movement.
ARB Short | Breakdown incomingARB Short | Breakdown incoming
| Targets On Chart
Not an overly complicated set up, challenging the 50EMA with a breakdown on the RVOI trendline and an ascending channel.

ARB next move ARB moving in a rising channel and a break down from the small range here is my trade setup with proper liquidity stop loss

Arbitrum $ARB to 1.60$ ?👑 #ARB/USDT BUY 👑
Entry:
1.1307✅
Targets:
1️⃣1.2568🎯
2️⃣1.3595🎯
3️⃣1.4622🎯
4️⃣1.6084🎯

ARB/USDT: Past Prediction Correct, Next Bull Run Target $10
Sure, here is the technical analysis of ARB/USDT in a more professional report format:
Current Price: $1.20
Previous Analysis: In a previous analysis, CryptoPatel predicted that ARB/USDT would dump from $1.50 to $0.90. This prediction was correct.
Current Resistance Level: $1.25
Expected Price Movement: CryptoPatel expects ARB/USDT to break the $1.25 resistance level and test the $1.43 resistance level. However, they also expect ARB/USDT to be rejected from the $1.43 level and fall back to the $0.7-$0.5 range. This range would be a good accumulation zone for long-term investors.
Next Bull Run: CryptoPatel expects ARB/USDT to reach a minimum of $10 in the next bull run.
Key Support and Resistance Levels:
Support: $1.07/$0.77
Resistance: $1.25/$1.43
Overall Outlook: CryptoPatel believes that ARB/USDT is currently in a downtrend and is expected to continue to fall in the short term. However, they also believe that ARB/USDT is a good long-term investment and could reach a minimum of $10 in the next bull run.
Follow us for more Quality analysis Chart.

Arbitrum longArbitrum bounced off the support level. Asset broke trough off the descending trendline. Bullish movement to resistance level at 1.4822 is possible.

ARB Cup & Handle trend revesal RB is reversing its downward trend, as confirmed by a Cup & Handle pattern.
Entering a position here provides a risk-reward ratio of 5.55:1.

ARBUSDTThis is my opinion with technical analysis
Please respect the following rules:
1- Risk management .
2. Have your own strategy.

Finally Arb Showing Strength Seems :Like ready For Bullish impulse Falling Wedge Breakout & Retest Has Already Done expecting 50 to 55% Bullish Wave In Midterm
