ArbBreakout is happening
Are you ready? Im am.
Wait for big return
Eth=arb
Daily and weekly is good for dip buy.
ARBUSDT trade ideas

Arbitrum-ARBUSD Periodic Analysis-Issue 80 (Free Access)The analyst believes that the price of Arbitrum will decrease within the time specified on the countdown timer. This prediction is based on a quantitative analysis of the price trend.
___Please note that the specified take-profit level does not imply a prediction that the price will reach that point. In this framework of analysis and trading, unlike the stop-loss, which is mandatory, setting a take-profit level is optional. Whether the price reaches the take-profit level or not is of no significance, as the results are calculated based on the start and end times. The take-profit level merely indicates the potential maximum price fluctuation within that time frame.

ARB Weekly Reversal in Progress!
Arbitrum (ARB) is showing strong signs of a major reversal from its long-term downtrend on the weekly chart. After printing a rounded bottom and consolidating at key support, price is beginning to curve upwards — a textbook reversal structure! 📉➡️📈
✅ Current price: $0.34 💥 Anticipated breakout path targets:
🎯 T1: $1.60
🎯 T2: $2.35
🎯 T3: $2.90

#ARB/USDT#ARB
The price is moving within a descending channel on the 1-hour frame, adhering well to it, and is heading for a strong breakout and retest.
We are seeing a bounce from the lower boundary of the descending channel, which is support at 0.2460.
We have a downtrend on the RSI indicator that is about to be broken and retested, supporting the upward trend.
We are looking for stability above the 100 Moving Average.
Entry price: 0.2720
First target: 0.2850
Second target: 0.2954
Third target: 0.3095

arbIm just seeing opportunities to go long on good value tokens.
None of this is financial advice, im just pointing out that if you are patient and know what you are looking for then the right times to trade are easy to spot.
my long strat has triggered

ARB Secondary trend. 24 04 2025Logarithm. Time frame 3 days (less is not necessary).
⚠️ Currently a decline from the maximum of -90% . For assets of such liquidity, these are not the lowest values, but perhaps the previous hype played a role in this. Work from the average price, or on a breakout , and you will not care when the reversal occurs. The main thing is to distribute the entry and exit points after the purchase in advance, that is, distribute the risk and profit. And, after that, no longer be interested in the asset, or opinions, or fictitious positive / negative news to stimulate demand / supply of “stupid money”. Do not get stuck in market noise and unnecessary, fear-driven or greed-driven opinions.
Main trend (the entire history of cryptocurrency trading), for clarity of pricing and the zone for work now, which is discussed.
ARB Main Trend 24 04 2025
🟣 Local trend. At the moment, a wedge-shaped formation has formed in it, there is an attempt to break through it and the price is clamped.
1️⃣ If this zone of minimums is held — for a start, the potential for a downward trend of the secondary trend (shown with a red line).
2️⃣ Then, when it is broken through , — to the channel median (green dotted line).

ARB Main Trend 24 04 2025Logarithm. Time frame 1 week.
Previously a very hyped coin, "killer" of something there...
Now - the dominant opinion is that this is a scam, a scam, "whales are selling now", and so on. It's funny to look at all this and how the opinion changes with the price. Crypto is a mess, there are no other words... That is, now is the time to take a closer look at the asset, and the start of the set.
If the price drops to lower values (shown on the chart), from the position of the trend, and potential percentages of the pump, the price is now acceptable, and the profit will be significant, but not "hamster". Set adequate goals, fix in parts as the trend develops, protect your profit. When there is an aggressive pump "with a stick", by a large %, - completely exit the asset, or protect the profit with a stop.
There is a small probability that an asset of such capitalization, and the unrealization of "buy a candy wrapper", will be knocked down in advance before the full 3rd alt season of this cycle, without distributing "prospects" on the "revival of faith".
⚠️ Now the decline from the maximum is -90% . For assets of such liquidity, these are not the lowest values, but perhaps the previous hype played a role in this. Work from the average price, or on a breakthrough and you will not care when the reversal occurs. The main thing is to distribute the entry and exit points after the purchase in advance, that is, distribute the risk and profit. And, after that, no longer be interested in the asset, or opinions, or fictitious positive / negative news to stimulate demand / supply of "stupid money". Do not get stuck in market noise and unnecessary opinions driven by fear or greed.
1️⃣ If this zone of minimums is held — for starters, the potential for a downward trend of the secondary trend (shown with a red line).
2️⃣ Then, when it is broken , — to the channel median (green dotted line).
🟣Local trend At the moment, a wedge-shaped formation has formed in it, there is an attempt to break through it and the price is clamped.


SHORT ARBWe are break through support line
all last days wasn't big anough volumes, but it appears suddenly today .
Thats a big sign of falling down

ARBUSDT 1D#ARB is moving inside a falling wedge pattern on the daily chart and is on the verge of breaking out above the resistance. In case of a breakout, the targets are:
🎯 $0.3949
🎯 $0.4772
🎯 $0.6226
🎯 $0.7402
🎯 $0.8578
Use a tight stop-loss.

What Has Warren Buffet, Elizabeth Warren & Arbitrum In Common?The good news is that the market is now turning green. All is well that ends well.
There was lots of excitement in late 2024 because of the bullish period, but this bullish period was followed by an even stronger bearish period. Just as there was excitement, now all that there is is depression. People are worn out, they can't take it anymore.
That's the signal. When the market participants are tired and ready to give up, that's when the market turns.
When nobody is around and people no longer care, that's the best time to buy and that's exactly when the market looks great.
When people are on vacation away from home, that's when the signals will start to show that the bearish wave is over, but people won't know.
When the market becomes strongly bullish again, it will be too late. There will be additional growth but when the majority decide to buy because of a challenge of the previous high, a new correction will form.
The participants seeing a correction and having samskaras of the previous bearish wave, they start thinking that this one will be the same and will last a long-term, so instead of holding they decide to fold. The moment they fold, the market resumes growing but too fast for them to decide to buy again and there goes the last run.
It is a psychological game. One has to buy when there is strong aversion to the market, one has to sell when the feeling is to stay in for as long as possible; forever growth.
When people start talking about Bitcoin going to $1,000,000 when it already trades at $160,000 or $180,000, that's the time to take profits.
When people start calling for Bitcoin to $5,000,000 and Michael Saylor starts making videos, that's the time to consider how much money you can withdraw.
When even Elizabeth Warren starts to admit that we were right and she was wrong, that's the moment to sell everything because the moment the bank puppet turns, that's the sure sign of a doom scenario.
The moment that Warren Buffet decides, "I am buying Bitcoin," that's it, all 21 million Bitcoins will be already gone. By the time Mr. Buffet figures out that Bitcoin is the new Internet, it will already be the year 2,140, it will be impossible to mine a new Bitcoin.
Actually, I don't know anything about these people, all I know is that Crypto is going up.
Arbitrum is ready to start a new wave of growth.
Namaste.

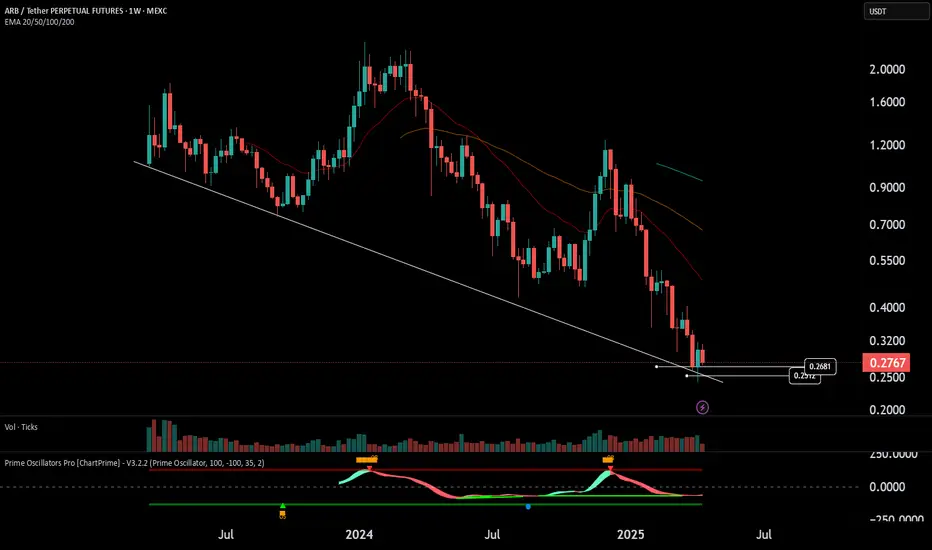
$ARB on a Multi-month support!AMEX:ARB is hovering on a multi-month support trendline, Bullish divergence forms on the oscillator using the ChartPrime oscillator pro.
If this support holds, 0.25 up to 0.268 could be a good buy zone for medium-term trade. @VIP
Note: using the logarithmic chart
#ARB/USDT Analysis📊 #ARB/USDT Analysis 📊
AMEX:ARB is forming a Falling Wedge Pattern on the Daily TF—a classic bullish setup in the making!
📈 Key Levels:
Resistance: PMH $0.4662
Breakout Level: PWH $0.3167
💡 AMEX:ARB needs to break above the Falling Wedge and PWH, followed by a retest for bulls.

The Bullish Case of ARB#Arbitrum has been declining since early 2024, forming a complex bearish trend despite strong fundamentals.
This fall is likely a corrective wave ahead of a potential bull-run toward a new ATH.
Breaking $0.24 is a minor invalidation, possibly offering a better entry lower.

TradeCityPro | ARB: Key Levels in DeFi Coin’s Descending Channel👋 Welcome to TradeCity Pro!
In this analysis, I want to review the ARB coin for you. It's one of the DeFi coins, currently ranked 54 on CoinMarketCap with a market cap of $1.41 billion.
⏳ 4-Hour Time Frame
In the 4-hour time frame, as you can see, we're witnessing a downtrend within a descending channel, and the price is moving downward.
✔️ There is a very important support at the 0.2501 level, which is the main support, and the price has already reacted to it once, bounced from the bottom of the channel, and is now positioned above the channel’s midline.
🔽 If the price fails to reach the top of the channel and gets rejected from lower levels such as the 0.3172 resistance, the probability of the channel breaking to the downside increases, and more bearish momentum may enter. When the price gets rejected before reaching the channel top, it indicates weakening buyer strength.
✨ So, if the price gets rejected from the 0.3172 resistance, we can open a suitable position. The lower the rejection, the higher the probability of a drop. A rejection from the channel top or even a fake breakout can also act as a valid trigger.
📉 The main trigger for a short position is the break of the 0.2501 level, which is a very strong support, and its break can lead to a significant bearish leg.
⚡️ For a long position, the first trigger is the break of 0.3172, which is a good area but very risky, because just above it lies the channel ceiling, and the price might get rejected from there and move downward.
🔼 Therefore, it's better to wait for the channel to be broken first and then look for a long trigger. Currently, the most reliable trigger for a long position after a channel breakout is at 0.4018, but this level is quite far. So, for a long position, we can also enter on a pullback to the channel or after getting confirmation from Dow Theory.
📝 Final Thoughts
This analysis reflects our opinions and is not financial advice.
Share your thoughts in the comments, and don’t forget to share this analysis with your friends! ❤️

Relief Rally or Further Drop? Key Levels to Watch on ARBUSDTARBUSDT continues its descent after invalidating the macro rising wedge, with price action firmly suppressed below key supply zones. Current wave structure hints at a potential relief rally toward 0.3886 before resuming the broader bearish trajectory toward the projected drop target at 0.1718. Until the macro descending trendline at 0.6259 is decisively broken, bearish sentiment remains dominant.

Arbitrum ARB price analysis💰 One can lose count of how many times the “next bottom” from #ARB has been given as "a gift".
⁉️ The only thing that can be assumed is that the behavior of the #Arbitrum price will repeat itself in a fractal fashion and grow to at least $0.57-0.67 by summer.
🪐 And then, if all the stars align with the parade of planets, and the OKX:ARBUSDT price will be able to gain a foothold above the aforementioned zone, it may continue to grow to $1-1.2.
It seems that once upon a time, this was the price at which #ARB was given away for free, and they forgot to think through one nuance: who will be pumping it if they are generously given to everyone)
_____________________
Did you like our analysis? Leave a comment, like, and follow to get more


Here Arbusdt now After we're seeing the up wave,
Now time to comeback to a fresh zone as you can see here and then wait a false breakout and see it continue up

ARB DAILY ANALYSISHi friends,
In today's analysis, we pay attention to ARB in the Daily time frame.
We have a key resistance level in weekly and daily timeframes at the price level of $0.826.
As you can see, it is already priced in and has lost about 77% of its value from its local top.
We have a downtrend daily and 4-Hour Channel as marked on the chart. Also, volume is increasing, and it's a good sign.
We have an entry level for long positions after channel breaking from the upper side at the price of $0.3944.
Also, we can have our alarms on the price level of $0.5, which is good for spot entry.

#ARB USDTEvery high is an opportunity to get out, don't miss the opportunity to buy at low prices
Don't rush to buy, soon the prices of all coins will return to where they started.
Do not trade futures in this market, only spot.
Please check all my previous analyses, all of them came true

ARBUSDT: What Happens Next Could Shock ManyYello, Paradisers! Are you watching this key level hold by a thread? The market is giving us signals, but most traders are too distracted to see them. If you're not careful here, you’ll be on the wrong side of the next big move.
💎ARBUSDT is currently trading below both the 50 EMA and the 200 EMA, confirming a strong bearish bias in the market. The trend remains in a clear markdown phase, with price action continuing to respect the descending channel, and no clear signs of bullish reversal just yet.
💎We’re approaching a moderate resistance level around $0.32 has already shown signs of weakness if price fails again at this area, it will likely confirm that sellers are still dominating, increasing the probability of a renewed leg down.
💎If the market rejects at current levels, the first key support to watch is around $0.2847, which could be hit quickly. However, the real danger lies below. A breakdown beneath the $0.2847 zone would expose the market to significant downside pressure, opening the path for a much deeper correction.
💎With ARB trading below the 200 EMA, we must remain cautious. The trend remains bearish, and any short term rally into resistance is more likely to present a shorting opportunity than a bullish breakout.
💎Still, if the market manages to close decisively above the $0.35 mark, it could shift the structure and momentum, targeting $0.37 and higher in the short term. Until then, the bias remains with the bears.
Stay focused, Paradisers. Be the hunter, not the hunted.
MyCryptoParadise
iFeel the success🌴

Bear Market Will Continue For Arbitrum ARBHello, Skyrexians!
Despite we expect the alt coin's dominance bottom at approximately 25th of April some altcoins like BINANCE:ARBUSDT can continue the bear market even further. Looking at the price chart we found the most likely and realistic scenario.
Let's take a look at the daily chart. Here we can see that on the Awesome Oscillator price has not crossed zero line and this is extremely bad. There is a high probability that currently asset is not in wave 5, but in wave 5 inside 3. This subway has the target $0.15-0.27. We suppose that $0.27 is our case. We will see the bounce in wave 4 soon to 0.38 Fibonacci and then the new deep dive to $0.2 in the wave 5. We pointed out the most conservative targets. Price can go even lower, but in our experience it's not likely because the max targets leads to price below zero.
Best regards,
Skyrexio Team
___________________________________________________________
Please, boost this article and subscribe our page if you like analysis!
