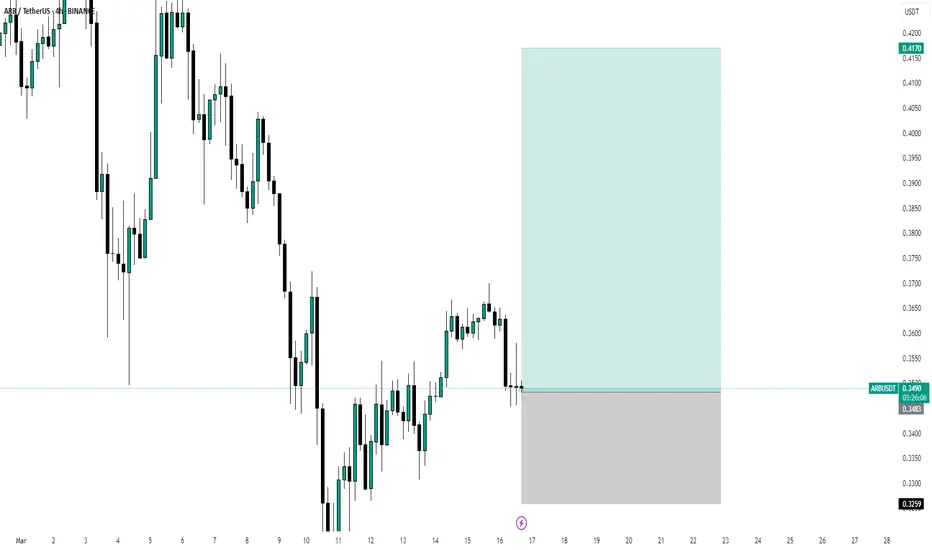
Lingrid | ARBUSDT pullback TRADE. Potential SHORT OpportunityBINANCE:ARBUSDT market tested the support level before rolling back toward the psychological level of 0.400, appearing to form an ABC pullback that typically precedes a retracement. With the market moving above last week's high, I anticipate a potential price drop after it grabs liquidity above that point. A comparison of the current bullish pullback with the stronger bearish moves on the left suggests the bears are more dominant than the bulls. If the market fails to break through the channel border, trendline, and resistance at 0.420, we can expect a downward movement to lower levels. My goal is support zone around 0.3500
Traders, If you liked this educational post🎓, give it a boost 🚀 and drop a comment 📣
ARBUSDT trade ideas

ARBUSDT 1DARB ~ 1D Analysis
#ARB Buy gradually after successfully penetrating this resistant line with a short -term target of at least 10%+.

ARB/USDT – The zone is interesting for starting accumulation.Arbitrum - is an Ethereum layer-two (L2) scaling solution. It uses optimistic rollups to achieve its goal of improving speed, scalability and cost-efficiency on Ethereum. Arbitrum benefits from the security and compatibility of Ethereum. Another benefit is the higher throughput and lower fees compared to Ethereum. That is made possible thanks to moving most of the computation and storage load off-chain.
Arbitrum’s native token is called ARB and is used for governance. Offchain Labs, the developers behind Arbitrum, announced the shift to a decentralized autonomous organization (DAO) structure — the Arbitrum DAO. ARB holders can vote on proposals that affect the features, protocol upgrades, funds allocation and election of a Security Council.
CoinMarketCap : #51
The hyped-up Arbitrum! 😂
📉 January - February - March 2024: Bloggers trapped a huge number of people, and now we’re seeing a massive -87% decline!
Looking at the main trend, a large descending channel is forming. The price is currently at the support of the inner channel, and if the market makes a final liquidity grab with a downward wick, the price could head toward the support of the outer channel, targeting a -30% drop.
In my previous trading idea, I marked the 1.1552 zone, which is exactly where the price reversed. Everything is marked on the chart—the potential profit is very solid, especially for spot trading. The price will react strongly to the resistance zones of both the inner and outer channels.
🚀 These are the moments to watch for position accumulation—when no one is interested and belief in growth is dead, not when everyone is screaming "BUY NOW!" at local tops!
*I will update the trading idea as the trend develops.

ABRUSDTHello guys, I hope you are well. We have ARB on the 4-hour timeframe. As you can see, on the daily timeframe, it is possible that we will have an engulfing. This will be confirmed when the price rises above 0.37. That is when we can say that the trend will be completely bullish. Prices will even see the fourteenth. If the price drops below 0.35, the probability of the downtrend continuing will reach 0.3192.

ARBUSDT Is About To Move Up 7% !!!Based On My Trading Algorithms ARBUSDT Is About To Move Down 7%!!!
Arbitrum ARB Is About To Flash Insane Long Signal!Hello, Skyrexians!
We decided to find the crypto assets with the largest potential and the proper Elliott waves structure and found BINANCE:ARBUSDT which is still at the bottom but has a great chance to print the super strong long signal.
Let's take a look at the weekly chart. We can count all the price action on the Binance exchange as the large irregular correction ABC. Wave C lasts already exactly one year. This wave always consists of 5 waves and here we can have a clear counting. Look how perfect was the wave 4 touch of 0.38-0.5 Fibonacci zone. Now price has reached the maximum target of wave 5. In conjunction with the divergence with the Awesome Oscillator, angulation with Alligator and potential green dot on or Bullish/Bearish Reversal Bar Indicator we can conclude that probability of reversal now is more than 80%. The only one thing we need to wait for the next week to see the green dot confirmation.
Best regards,
Skyrexio Team
___________________________________________________________
Please, boost this article and subscribe our page if you like analysis!

ARB: Capitalizing on Layer 2 Scaling Growth
Description:
This trading idea focuses on ARB, the native token of Arbitrum, a leading Layer 2 scaling solution for Ethereum. ARB plays a key role in enhancing transaction speed and reducing fees while maintaining Ethereum’s security and decentralization. With increasing demand for scalable blockchain solutions, Arbitrum has emerged as a dominant player, attracting developers and liquidity to its ecosystem. As DeFi, NFTs, and Web3 applications continue to expand, ARB is positioned for potential long-term growth due to its strong adoption and ongoing network upgrades.
However, cryptocurrency investments carry inherent risks, including market volatility, regulatory changes, and macroeconomic factors. The performance of ARB can be influenced by shifts in investor sentiment and competition in the Layer 2 space, making risk management essential for traders.
Disclaimer:
This trading idea is for educational purposes only and should not be considered financial advice. Trading cryptocurrencies like ARB involves significant risk, including the potential loss of your entire investment. Always conduct thorough research, assess your financial position, and consult with a financial advisor before making any investment decisions. Past performance is not indicative of future results.

ARBUSDT BUY OpportunityARBUSDT is moving within an ascending channel. The plan is to accumulate within the designated buy-back area and use the recommended stop loss. Following the success of our last analysis on this coin, we anticipate similar profitable outcomes. Targets to watch are delineated on the chart. Enjoy.
Checkout the last work done on this:

Three big goals for ARBGiven ARB's investments in meme coins, ARB could be of interest to the market, it has bigger goals, but we are currently holding on to the first resistance.

Breaking: Arbitrum Surged 12% Today- Enroute Bullish BreakoutArbitrum spike 12% today amidst the general crypto dip. The Ethereum layer-two (L2) scaling solution that uses optimistic rollups to achieve its goal of improving speed, scalability and cost-efficiency on Ethereum was in a prolong dip that saw its token dipped to $0.37 level with growing momentum a breakout above the $0.622 resistant point could pave way for major breakout for AMEX:ARB coin as that is the current barrier holding AMEX:ARB from breaking Out.
With the Relative Strength Index (RSI) at 43, AMEX:ARB could capitalize on this growing momentum. Further validating the bullish thesis is the fact that AMEX:ARB is trading below key moving averages.
Data from DefiLlama shows about $2.576 Billion is locked in the Arbitrum ecosystem. This numbers shows a level of trust placed on the layer 2 ecosystem. Similarly, about $1.276 Billion volume has been circulated in the Arbitrum ecosystem for the past 3 days.
Arbitrum Price Live Data
The live Arbitrum price today is $0.424093 USD with a 24-hour trading volume of $393,289,251 USD. We update our ARB to USD price in real-time. Arbitrum is up 11.42% in the last 24 hours, with a live market cap of $1,874,197,514 USD. It has a circulating supply of 4,419,312,625 ARB coins and the max. supply is not available.


ARBUSDT at a Crossroads: Breakout or Rejection Incoming?Yello, Paradisers! Is ARBUSDT gearing up for a breakout, or will it face rejection? Let’s break it down.
💎#ARBUSD is currently testing a major descending trendline while hovering above key support zones at $0.4246. Buyers are showing strength, but the resistance ahead could dictate the next move.
💎If #Arbitrum breaks out and closes above the trendline and 200 EMA with strong volume, it will confirm a bullish push toward the supply zone at $0.4604 - $0.4946. This would signal a shift into a markup phase, with momentum favoring the bulls.
💎 If the price consolidates or struggles at resistance with weak volume, it could indicate hesitation. In this case, sideways movement or a rejection could follow, meaning it's best to wait for clearer confirmation before entering a trade.
💎If #ARB fails to break the descending resistance and closes below the demand zone at $0.4047, the bullish setup is invalidated, and further downside becomes the next likely scenario, aligning with the broader downtrend.
Discipline and patience win the game, Paradisers! If the breakout happens with strong volume, we strike. If hesitation or rejection appears, we wait. No need to force trades we move when the market moves.
MyCryptoParadise
iFeel the success 🌴

ARB USDT💰 #ARB (Arbitrum) Analysis
AMEX:ARB Primary Entry: Around $0.2905 if price holds support and shows bullish price action.
Breakout Entry: Consider adding more if price breaks above $0.7386, confirming the bullish reversal.
🔹 Target Levels:
T1: $0.7386
T2: $1.1576

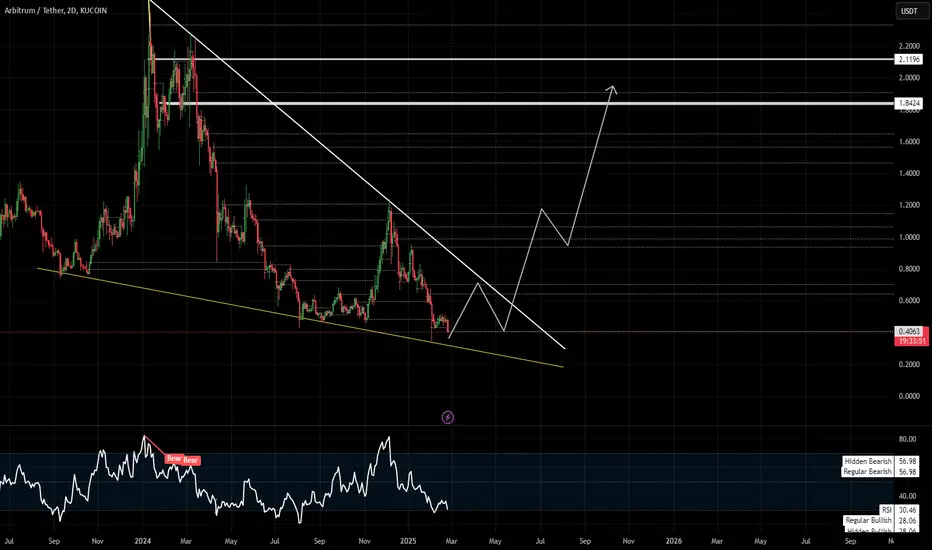

ARB LongArbitrum has formed a clear downward channel. It also showed a price minimum at the beginning of the month. In my opinion, the trend resistance level will be broken in the near future and the price will go higher. A retest of the level with a subsequent impulse is also possible.

#ARB/USDT Analysis!#ARB/USDT Analysis!
📉 Rejecting from the Diagonal Trendline in 4H TF!
🔹 Waiting for a breakout/retest to long $ARB.
🔹 Local Resistance: PML $0.5155
🔹 Support Level: PWL $0.3488
Patience is key here! 🧐

UNIVERSOFSIGNALS| ARBUSDT The Most Important Support of Its Life👋 Welcome to the UNIVERSOFSIGNAL !
Let's analyze and review one of our important Layer 2 projects, which is currently at one of its most critical support levels, and update our previous analysis.
🌐 Overview Bitcoin
As always, before starting our analysis, let’s take a look at Bitcoin on the one-hour timeframe. We have settled down a bit compared to yesterday's fluctuations, but it’s still not a great time to open futures positions because any news can trigger stop-losses.
However, if you insist on opening a position, the breakout of 100,026 wouldn’t be a bad entry, but you must reduce your risk. These days, it’s better to be an observer in futures trading. On the other hand, Bitcoin dominance is also crucial with this level’s breakout—if it turns green, you can open a position; otherwise, it’s better to switch to an altcoin or not open any position at all.
🕒 Weekly Timeframe
ARBUSDT has rebounded from its most critical weekly support and made an upward move, reaching a key resistance at $0.9578.
The RSI has also entered its overbought zone, which isn’t an ideal buy signal and suggests a correction might be necessary.
If you’ve joined after the breakout of the $0.6496 resistance, you can consider pulling out your initial capital, leaving the coin essentially free for you.
If you haven’t entered yet, I’ll explain in the lower timeframes.
🛠️ Daily Timeframe
Previously, ARBUSDT followed a downtrend and reached the $0.4749 support zone with strong trend weakness.
This formed an accumulation zone, and after creating a higher low within it, the coin broke above the range and rose towards the $0.9689 resistance.
Wait for a breakout above $0.9689, accompanied by RSI entering the overbought zone again.
pullback could bring ARBUSDT to $0.8028 in the mid-term. At that point, look for a bullish confirmation candle for a potential buy.
⏱ 4-Hour Timeframe
This is the primary timeframe for futures trading. The price shows a compression pattern, forming higher lows and equal highs, indicating a possible breakout.
📈 Long Position Trigger
position can be taken after breaking $0.9689 , Set a stop-buy order beforehand since whale-driven movements might occur, pushing RSI beyond 75.14.
📉 Short Position Trigger
I do not recommend opening a short position. Even if the trendline breaks, I’d prefer waiting.
As long as the price stays above $0.7980, focus on long opportunities.
🔗 TradingView Chart
💡 BTC Pair Insight
ARBUSDT compared to Bitcoin has been bearish in the long term , However, after the Layer-2 hype cooled, the token showed strong trend weakness, printing several green candles.
The main trigger here is the breakout of 0.00001004, allowing for significant upward movement if the market turns bullish.
📝 Final Thoughts
Stay calm, trade wisely, and let's capture the market's best opportunities!
This analysis reflects our opinions and is not financial advice.
Share your thoughts in the comments, and don’t forget to share this analysis with your friends! ❤️

Arb Long/Spot Idea - A potential 9r trade.It seems that accumulating arb near the levels mentioned in chart can give us good returns. If arb has to go up then we can see decent gains. Best would be to add it on spot with SL on 4h candle close.
#NFA #DYOR

Arbitrum-ARBUSD Periodic Analysis (Issue 63)The analyst believes that the price of { ARBUSD } will increase in the next 24 hours. This prediction is based on quantitative analysis of the price trend.
Please note that the specified take-profit level does not imply a prediction that the price will reach that point. In this framework of analysis and trading, unlike the stop-loss, which is mandatory, setting a take-profit level is optional. Whether the price reaches the take-profit level or not is of no significance, as the results are calculated based on the start and end times. The take-profit level merely indicates the potential maximum price fluctuation within that time frame.


