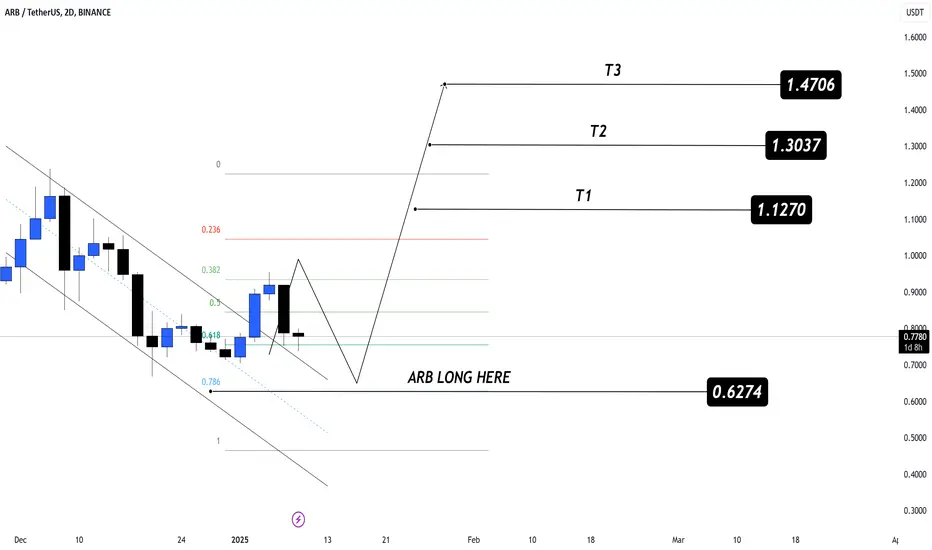
ARB Next Target: $1.4706
🔵 Long Zone:
1️⃣ $0.6274
🎯 Targets:
1️⃣ $1.1270
2️⃣ $1.3037
3️⃣ $1.4706
🛡 Stop Loss: Below $0.60
ARBUSDT trade ideas
ARBUSDT Potentially BullishBINANCE:ARBUSDT hits its lowest support area at the 0.4605 area creating a double bottom around the lowest support and a neckline at the 0.6537 level. We have seen the neckline broken and retested almost immediately however, price has come back to same area for a major structural retest. If this holds as a new found support, we just might see price going higher and a 10x is highly possible.
Potential buying areas:
0.6537
0.7393
0.8228
I will not just buy at these areas without seeing price action setup indicating the buy opportunity, hence do your due diligence before taking any trade idea
Past results does not guarantee future results
#ARBUSDT

ARB/USDT Symmetrical Triangle Breakout with Pullback OpportunityThe chart depicts a Symmetrical Triangle pattern, indicating a phase of consolidation followed by a confirmed breakout to the upside. Currently, the price is undergoing a pullback, presenting a potential opportunity for entry within the retracement zone.
Key Observations
1. The Symmetrical Triangle structure has already been breached, signaling the continuation of bullish momentum.
2. The price is retracing towards the $0.85–$0.84 zone, which aligns with key support and represents an attractive area for accumulation.
3. The projected target post-breakout is approximately $1.00, consistent with historical resistance levels and the triangle's measured move.
Strategic Implications
Focus on the pullback as a buying opportunity near $0.85–$0.84. Ensure the pullback holds within this range to confirm support and validate the bullish setup. Look for signs of reversal, such as bullish candlestick patterns or increased volume, to reinforce confidence in the trade. Set a stop-loss below $0.80 to mitigate downside risk, while aiming for the $1.00 target as the primary profit zone.

ARB LONGThis analysis compares the current price action of ARB/USDT (left chart) with the previous Bitcoin cycle (right chart). The price action suggests a potential setup for a long position at a favorable discount, identified around the 0.382 retracement level (shown in red on the ARB/USDT chart).
Key observations:
We expect a significant pullback towards the 0.382 level, which has previously acted as a key support zone, creating a potential buying opportunity.
Similar to the previous Bitcoin cycle, the current price structure shows a sharp retracement followed by a possible continuation to the upside.
The next potential resistance zone, or "buyside liquidity," is marked on the chart, which could act as a target for the upcoming move higher.
Trade Plan:
Entry: At the 0.866 level or lower, near the 0.382 retracement zone.
Stop Loss: Below 0.7558
Take Profit : Target the next resistance zone near the 1.10 level, aligning with the buyside liquidity area or higher.

#ARB: Unlocking Scalability With Arbitrum#ARB: Unlocking Scalability With Arbitrum
Description:
This trading idea highlights ARB, the native token of the Arbitrum ecosystem, a leading Layer 2 scaling solution for Ethereum. Arbitrum is designed to enhance Ethereum's scalability by enabling faster and cheaper transactions while maintaining the security and decentralization of the main Ethereum network. ARB plays a pivotal role in the ecosystem, supporting governance and incentivizing user participation. As demand for Layer 2 solutions grows due to congestion and high fees on Ethereum, ARB stands out as a key asset driving adoption in decentralized applications and DeFi.
However, it's important to remember that the cryptocurrency market is highly volatile and influenced by factors like regulatory developments, market sentiment, and technological changes. Investing in ARB or other digital assets carries inherent risks and requires proper risk management strategies.
Disclaimer:
This trading idea is for educational purposes only and does not constitute financial advice. Cryptocurrencies like ARB are speculative investments with substantial risk, including the potential loss of your entire capital. Always perform thorough research, evaluate your financial situation, and consult a professional financial advisor before making investment decisions. Past performance is not indicative of future results.


ARBUSDT is poised for a massive breakout!ARBUSDT is poised for a massive breakout!
The current price is $0.89, with a target price of $2.20, representing a potential gain of 150%+. The Support Resistance retesting is now completed, indicating a strong bullish reversal. This setup suggests that ARBUSDT is ready to surge towards our target price. The retest of the support level has confirmed the strength of the bullish trend. We're confident in our analysis, and this could be a lucrative trading opportunity. Keep a close eye on ARBUSDT, as it's preparing for a potential price explosion!. Get ready to ride the bullish wave!

ARBUSDT: Weak for Too Long, But the Blue Box Holds Promise!ARBUSDT: Weak for Too Long, But the Blue Box Holds Promise! 💪
Key Points to Consider:
Extended Weakness: ARBUSDT has been underperforming for an extended period, showing minimal strength in the market.
Blue Box Opportunity: Despite its weakness, the blue box presents a well-calculated demand zone where a reaction is highly possible.
Calculated Risk: No reason to pass up on this opportunity with proper risk management in place.
Why Take the Shot?
Even the weakest assets can rebound sharply from strategically chosen zones. This blue box is identified using advanced techniques like CDV, liquidity heatmaps, volume profiles, and volume footprints.
My Process:
When trading the blue box, I always look for confirmation with upward market structure breaks on lower time frames.
Think this approach resonates with you? Boost, comment, and follow for more insights. Let’s trade smart together! 💡
Let me tell you, folks, this is amazing. Nobody does analysis like I do. Believe me. If this helps you, don't forget to boost and comment! It’s a big deal, motivates me to share even more winning insights with you. Tremendous insights.
I keep my charts the best, clean, simple, and clear. You know it, I know it, clarity leads to better decisions. No question about it. My approach? Built on years of tremendous experience. Incredible track record. I don’t claim to know it all, but I spot high-probability setups like nobody else. Trust me.
Want to learn how to use the heatmap, cumulative volume delta, and volume footprint techniques I use to determine demand regions with stunning accuracy? Send me a private message—totally free, folks. That’s right. I help anyone who wants it, absolutely no charge. Unbelievable value.
Here’s the list, long list, great list, of some of my previous incredible analyses. Each one, a winner:
🎯 ZENUSDT.P: Patience & Profitability | %230 Reaction from the Sniper Entry
🐶 DOGEUSDT.P: Next Move
🎨 RENDERUSDT.P: Opportunity of the Month
💎 ETHUSDT.P: Where to Retrace
🟢 BNBUSDT.P: Potential Surge
📊 BTC Dominance: Reaction Zone
🌊 WAVESUSDT.P: Demand Zone Potential
🟣 UNIUSDT.P: Long-Term Trade
🔵 XRPUSDT.P: Entry Zones
🔗 LINKUSDT.P: Follow The River
📈 BTCUSDT.P: Two Key Demand Zones
🟩 POLUSDT: Bullish Momentum
🌟 PENDLEUSDT.P: Where Opportunity Meets Precision
🔥 BTCUSDT.P: Liquidation of Highly Leveraged Longs
🌊 SOLUSDT.P: SOL's Dip - Your Opportunity
🐸 1000PEPEUSDT.P: Prime Bounce Zone Unlocked
🚀 ETHUSDT.P: Set to Explode - Don't Miss This Game Changer
🤖 IQUSDT: Smart Plan
⚡️ PONDUSDT: A Trade Not Taken Is Better Than a Losing One
💼 STMXUSDT: 2 Buying Areas
🐢 TURBOUSDT: Buy Zones and Buyer Presence
🌍 ICPUSDT.P: Massive Upside Potential | Check the Trade Update For Seeing Results
🟠 IDEXUSDT: Spot Buy Area | %26 Profit if You Trade with MSB
📌 USUALUSDT: Buyers Are Active + %70 Profit in Total
🌟 FORTHUSDT: Sniper Entry +%26 Reaction
🐳 QKCUSDT: Sniper Entry +%57 Reaction
📊 BTC.D: Retest of Key Area Highly Likely
And that’s just the start. The list goes on and on, folks. It’s a tremendous list, the best. I stopped adding because, frankly, it’s tiring. So many wins. People are amazed. You can check my profile and see for yourself, winning moves, all the time. Believe me, nobody does it better.

#ARB/USDT Ready to go higher#ARB
The price is moving in a descending channel on the 1-hour frame and sticking to it well
We have a bounce from the lower limit of the descending channel, this support is at 0.7400
We have a downtrend on the RSI indicator that is about to be broken, which supports the rise
We have a trend to stabilize above the moving average 100
Entry price 0.7600
First target 0.7911
Second target 0.8161
Third target 0.8400

wave 2Start of wave c from 2
It has the ability to move up to the yellow box according to the level of 0.618 to 0.786.

get ready to getting down So been , chaotic last few tens minutes, but know we got that volatility due to trend changing, and we already incline to do down .
got back to 0,858 purpose or nearby


SHORT 85 % long positions ,
And starting distribution according to CVD
so could take so fst move to down,

ARB 4H Downtrend
In the 4H Timeframe, I'm expecting another leg down to retest 0.6676 low.
Ideally, I'd like to see a reversal pattern in the 1H timeframe against green resistance just above 0.90.

ARB - Bullish Alignment - MACD, RSI, Bull Flag BreakoutBINANCE:ARBUSDT Breaking out of it's bull flag formation with bullishly aligned Momentum indicators - MACD, RSI all pointing that the reversal is in, with room to run higher.
Target 1 - 1.2
Target 2 - 2.2

Arb Analysis BINANCE:ARBUSDT BINANCE:ARBUSDT.P MEXC:ARBUSDT
Here’s a detailed analysis of the ARB/USDT (Arbitrum/USD Tether) weekly chart, including Fibonacci retracement levels, support and resistance zones, and possible price movements.
---
### **1. Key Levels**
- **0% (low)**: **0.4224**.
- **0.618 Levels**: **1.1879** and **1.1238—Fibonacci's golden pocket area, representing a strong resistance zone.
- **0.5 Level**: **1.4244—the midpoint of Fibonacci retracement, acting as a secondary resistance level.
100% (High)**: **2.4263**.
---
### **2. Price Action and Current Situation**
Current Price**: **0.8310**, sitting near a support zone.
Support Zone**: **0.812**, where price has found stability so far.
Key Resistance**: Fibonacci levels between **1.1238–1.1879**.
---
### **3. Support and Resistance Zones**
- **Support**:
-0.812: Current support level holding the price.
- **0.4224**: Strong historical support, acting as the last defense if the price drops significantly.
- **Resistance**:
1.1238–1.1879: The golden pocket zone (strong resistance where a pullback or slowdown may occur).
1.4244: Secondary resistance at the 0.5 Fibonacci level.
---
### **4. Fibonacci-Based Trading Strategy**
Buying Opportunity (Buy)**:
Consider entering near the **0.812** level if support holds.
Stop-loss: Place below **0.812**, such as at **0.750**, to limit losses.
- **Take-Profit Targets**:
First target: **1.1238–1.1879** zone.
Second target: **1.4244** level.
---
### **5. Technical Analysis and Possible Scenarios**
Bullish Scenario (Upward Movement)**:
If the price holds above **0.812**, the next move could be toward the **1.1238–1.1879** resistance zone.
A break above this zone could push the price to $**1.4244** or higher.
Bearish Scenario (Downward Movement)**:
If the price breaks below **0.812**, it might revisit the **0.4224** support level.
---
### **6. Trading Recommendations**
Current Buying Opportunity**:
Buying near **0.812** can be a good entry, considering clear stop-loss and take-profit levels.
- **Confirmations**:
RSI: Check if the price is oversold or overbought to validate the entry.
MACD: Use to confirm trend strength or weakness.

Is ARB Poised for a Major Move? Here’s What You Need to WatchYello, Paradisers! Are you ready for a potential game-changing move in #ARBUSDT? The current setup hints at a decisive moment that could lead to either a breakout or a steep decline. Let’s dive into the details to see what’s unfolding.
💎#ARBUSDT is currently sitting between two critical levels. On the upside, the $0.8400 minor resistance is a key threshold that buyers need to breach to regain momentum. A successful break above this level could open the door to $1.00 and eventually test the major resistance zone at $1.2389–$1.2949. This area represents a psychological and technical barrier likely to attract significant profit taking. Overcoming it, however, could trigger an explosive rally as bullish sentiment takes hold.
💎On the downside, the support zone at $0.6515 is acting as a safety net for now. If this level fails, #Arbitrum could descend into the demand zone at $0.5685. A decisive bounce from here, coupled with increased volume, could signal the start of a rally targeting resistance levels and beyond. Conversely, a failure to hold this zone would confirm a bearish breakdown, inviting further downside movement.
💎The battle between bulls and bears hinges on how #ARB reacts to these critical levels. If buying volume increases near $0.8400 and #ARBUSD clears it with strength, the momentum shift could drive prices higher toward the $1.2389 region. Conversely, any rejection at $0.8400 or weakness near $0.6515 would signal that sellers are still in control, increasing the likelihood of a breakdown.
Keep an eye on trading volume, as it will confirm the strength of any breakout or breakdown. Low volume moves are often fakeouts, so stay cautious and wait for clear signals before entering a trade.
MyCryptoParadise
iFeel the success🌴

ARBUSDT 4DARB Update ~ 4D
#ARB So far it still maintains its bullish structure. This is a very good Support Block for your next purchase. Minimum target 20%++

$ARB #ARB #ARBITUMWe are currently in an accumulation phase, and based on my technical analysis, this coin could potentially reach $10 by the end of this bull run. However, we will face significant resistance at around $1.20. Once we break through that level, the next key resistance is at $2.41. After that, the potential for growth will largely depend on adoption, and beyond that, the possibilities are limitless.
*Nothing is financial advice and this basically my personal opinion*

#ARB (SPOT) entry range( 0.4650- 0.6150) T.(1.3990) SL(0.4287)BINANCE:ARBUSDT
entry range ( 0.4650- 0.6150)
Target1 (0.9000) - Target2 (1.0740)- Target3 (1.3990)
1 Extra Targets(optional) in chart, if you like to continue in the trade with making stoploss very high.
SL .1D close below (0.4287)
*** collect the coin slowly in the entry range ***
*** No FOMO - No Rush , it is a long journey ***
**** #Manta ,#OMNI, #DYM, #AI, #IO, #XAI , #ACE #NFP #RAD #WLD #ORDI #BLUR #SUI #Voxel #AEVO #VITE #APE #RDNT #FLUX #NMR #VANRY #TRB #HBAR #DGB #XEC #ERN #ALT #IO #ACA #HIVE #ASTR #ARDR #PIXEL #LTO #AERGO #SCRT #ATA #HOOK #FLOW #KSM #HFT #MINA #DATA #SC #JOE #RDNT #IQ #CFX #BICO #ARB ****

Arbitrum-ARBUSD Periodic Analysis (Issue 55)The analyst believes that the price of { ARBUSD } will increase in the next 24 hours. This prediction is based on quantitative analysis of the price trend.
Please note that the specified take-profit level does not imply a prediction that the price will reach that point. In this framework of analysis and trading, unlike the stop-loss, which is mandatory, setting a take-profit level is optional. Whether the price reaches the take-profit level or not is of no significance, as the results are calculated based on the start and end times. The take-profit level merely indicates the potential maximum price fluctuation within that time frame.

Arbitrum0.75$ is the last major support for AMEX:ARB , if it is lost 0.50$ will be the next major support and imo the price will bounce from there. However if we see a bullish breakout ARB has to hold 0.90$, Then we might even have a double top at 1.20$ if not ,1.40$ and 2$ can be the mid-term targets. we have to wait but be cautious tho

ARBUSDT Elliott Waves (Local Setup)Hello friends.
Please support my work by clicking the LIKE button👍(If you liked).
Everything on the chart.
Entry zone: market and lower
Targets: 1.1 - 1.3 - 1.5
after first target reached move ur stop to breakeven
Stop: ~0.6 (depending of ur risk).
ALWAYS follow ur RM
risk is justified
It's not financial advice.
DYOR!
