Crypto Live Profits - April 22nd 2025 - Farid PremaniJoin our free facebook signals group
facebook.com/groups/faridpremani
Facebook signals channel
facebook.com/messages/t/27924832330464559/
Copy trade on BingX and get discounted pricing
bingx.com/en/CopyTrading/1424883401129910277/?inviteCode=ZQWRV1&inviteId=ba63f410-d430-4dcb-a844-172e73de0207

ARCUSDT LONG IDEAhi all. when we look at the arcusdt chart, we can see that price dropped hard in the last two weeks. it seems that price trying to recover. EMA breakout on 1h chart almost happened. also price seems accumulating in the box.i expect price at least touches 50 EMA on 4h timeframe chart. so we can

#ARCUSDT is showing signs of reversal📉 Short BYBIT:ARCUSDT.P from $0.06780
🛡 Stop loss $0.07117
🕒 1H Timeframe
⚡️ Overview:
➡️ The main POC (Point of Control) is at 0.05873, indicating the area with the highest trading volume.
➡️ The 0.07117 level acts as strong resistance where the price previously reversed.
➡️ The chart shows

Potential Head and Shoulders Pattern on ARCSOL/USDTTimeframe: 1H | Exchange: MEXC
Date: March 23, 2025
Hey traders! 👋
Spotted a possible Head and Shoulders pattern forming on ARCSOL/USDT. 👀
Left Shoulder: Around 0.0503
Head: Bottomed out at 0.0415
Right Shoulder: Currently forming near 0.0471
This pattern is typically a bearish reversal signal

Inverse Head & Shoulders Pattern on ARCSOL/USDTChart Timeframe: 1H | Exchange: MEXC
📅 March 23, 2025
This setup is looking textbook bullish! A clean Inverse Head and Shoulders has printed, backed by volume and momentum confluence.
📐 Pattern Anatomy:
Left Shoulder: ~$0.0503
Head (Major Low): ~$0.0415
Right Shoulder: ~$0.0471
Neckline Breako

ARC ANALYSIS🔮 #ARC Analysis
💲💲 #ARC is trading in a Symmetrical Triangle Pattern. If the price of #ARC breaks and sustain the higher price then will see a pump. Also there is an strong support zone. We may see a retest towards the support zone first and then a reversal📈
⁉️ What to do?
- We have marked cruci

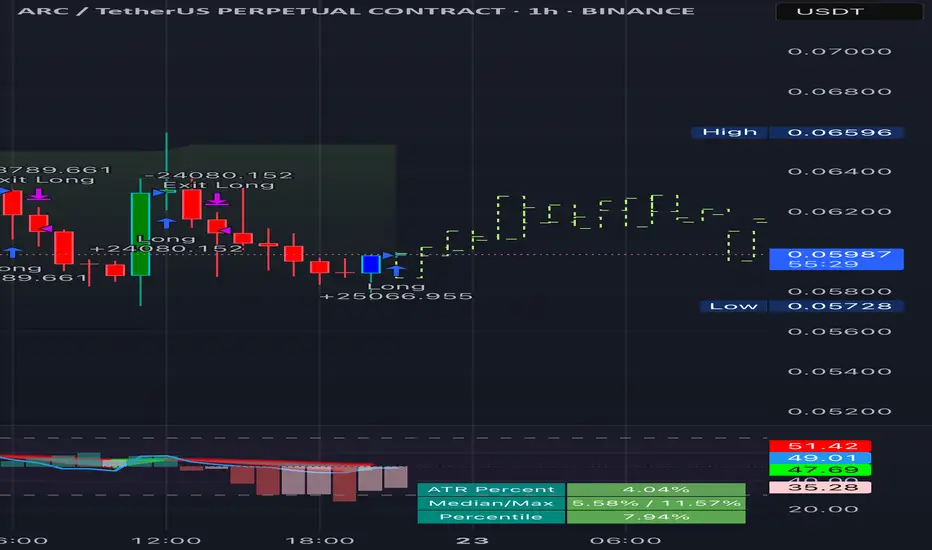
ARC/USDT - Elliott Wave Completion and ABC Correction ExpectedThe ARC/USDT perpetual contract on Binance has completed a classic 5-wave Elliott impulse pattern, peaking at wave (5). Based on Elliott Wave Theory, a corrective ABC pattern is expected, with wave A initiating a decline.
Entry: Short position near wave (5) peak
Target: Wave C completion zone arou

Bullish pattern signalThere is a short-term bullish pattern forming, indicating a potential profit target of 2% upon reaching it. It's important to closely monitor the liquidity in the market, as fluctuations could impact price movement significantly. Keep an eye on trading volumes and support levels to gauge the strengt
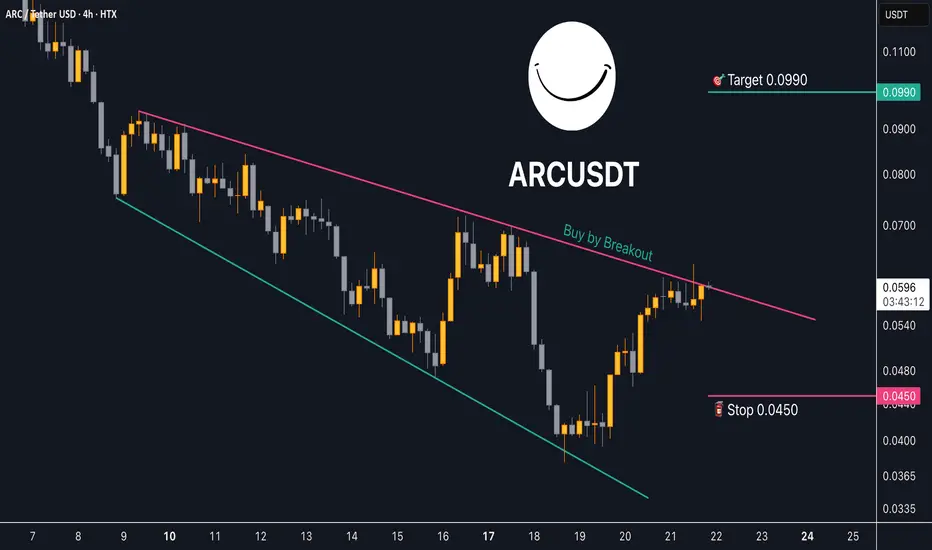
Trading opportunity for AI Rig Complex ARCUSDTBased on technical factors there is a Buy position in :
📊 ARCUSDT
🔵 Buy Now
🪫Stop loss 0.0450
🔋Target 0.0990
📏 R/R 2,7
💸RISK : 1%
We hope it is profitable for you ❤️
Please support our activity with your likes👍 and comments📝
Trading opportunity for ARCUSDTBased on technical factors there is a Buy position in :
📊 ARCUSDT
🔵 Buy Now
🪫Stop loss 0.0310
🔋Target 0.0600
📏 R/R 1,8
💸RISK : 1%
We hope it is profitable for you ❤️
Please support our activity with your likes👍 and comments📝

See all ideas
Summarizing what the indicators are suggesting.
Oscillators
Neutral
SellBuy
Strong sellStrong buy
Strong sellSellNeutralBuyStrong buy
Oscillators
Neutral
SellBuy
Strong sellStrong buy
Strong sellSellNeutralBuyStrong buy
Summary
Neutral
SellBuy
Strong sellStrong buy
Strong sellSellNeutralBuyStrong buy
Summary
Neutral
SellBuy
Strong sellStrong buy
Strong sellSellNeutralBuyStrong buy
Summary
Neutral
SellBuy
Strong sellStrong buy
Strong sellSellNeutralBuyStrong buy
Moving Averages
Neutral
SellBuy
Strong sellStrong buy
Strong sellSellNeutralBuyStrong buy
Moving Averages
Neutral
SellBuy
Strong sellStrong buy
Strong sellSellNeutralBuyStrong buy
Related pairs
Frequently Asked Questions
The current price of AI RIG COMPLEX/USD TETHER (ARC) is 0.0509 USDT — it has risen 45.85% in the past 24 hours. Try placing this info into the context by checking out what coins are also gaining and losing at the moment and seeing ARC price chart.
AI RIG COMPLEX/USD TETHER price has risen by 29.19% over the last week, its month performance shows a −11.79% decrease, and as for the last year, AI RIG COMPLEX/USD TETHER has decreased by −88.41%. See more dynamics on ARC price chart.
Keep track of coins' changes with our Crypto Coins Heatmap.
Keep track of coins' changes with our Crypto Coins Heatmap.
AI RIG COMPLEX/USD TETHER (ARC) reached its highest price on Jan 24, 2025 — it amounted to 0.4941 USDT. Find more insights on the ARC price chart.
See the list of crypto gainers and choose what best fits your strategy.
See the list of crypto gainers and choose what best fits your strategy.
AI RIG COMPLEX/USD TETHER (ARC) reached the lowest price of 0.0277 USDT on Apr 9, 2025. View more AI RIG COMPLEX/USD TETHER dynamics on the price chart.
See the list of crypto losers to find unexpected opportunities.
See the list of crypto losers to find unexpected opportunities.
The safest choice when buying ARC is to go to a well-known crypto exchange. Some of the popular names are Binance, Coinbase, Kraken. But you'll have to find a reliable broker and create an account first. You can trade ARC right from TradingView charts — just choose a broker and connect to your account.
AI RIG COMPLEX/USD TETHER (ARC) is just as reliable as any other crypto asset — this corner of the world market is highly volatile. Today, for instance, AI RIG COMPLEX/USD TETHER is estimated as 50.73% volatile. The only thing it means is that you must prepare and examine all available information before making a decision. And if you're not sure about AI RIG COMPLEX/USD TETHER, you can find more inspiration in our curated watchlists.
You can discuss AI RIG COMPLEX/USD TETHER (ARC) with other users in our public chats, Minds or in the comments to Ideas.