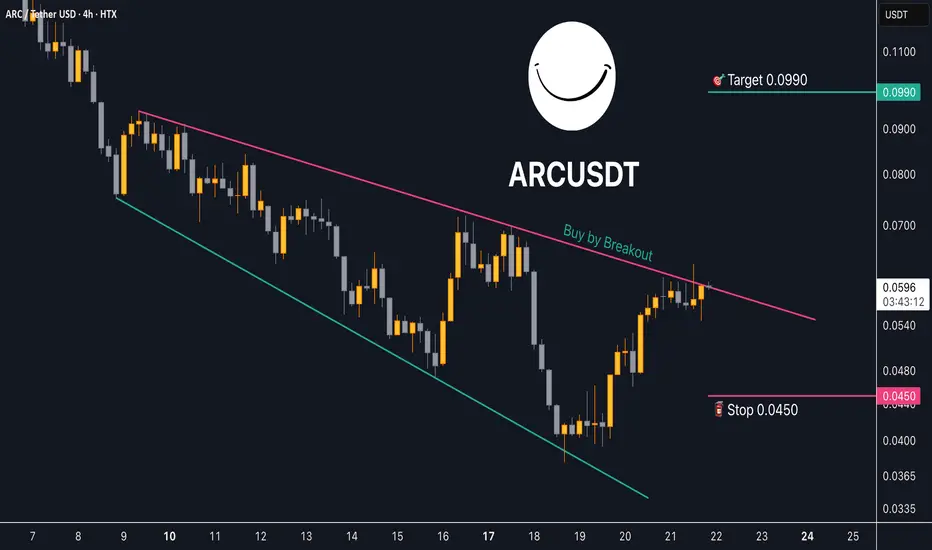
ARCUSDT - Bullish Breakout Confirmed ARC has been trading in a well-defined descending channel for several weeks, forming a consistent downtrend. However, the price has now broken out of the channel resistance, signaling a potential bullish reversal.
Descending Channel Breakout: ARC has clearly broken above the channel’s upper trendline, indicating a shift in market structure from bearish to bullish.
Resistance Zone Flipped: The price broke through a recent horizontal resistance zone.
EMA: ARC is now trading above both the 50 EMA and 100 EMA,
ARCUSDT trade ideas

ARC dead cat bounce or support... RR is a factorARC is at a very important level. Price action will define support or follow-through for a continuation down. There is a lot of volume at this current price, which can cause volatility. Momentum and trend oscillators are not yet oversold on the daily, which leaves room for more downside.
Full TA: Link in the BIO

$ARC - Long SetupBITGET:ARCUSDT | 1D
We can risk on cmp but leave something for dca if it dips a bit around .060 to .056
If we can hold .060 to .056, we can target .068 (initial) to .16 (final)
Stoploss just below .05 to .047
Targets:
.068 - .076
.090 - .106
.132 - .162

Retest long on $ARCA speculative play as honestly i think this coin is worthless.
Have been observing this coin for quite some time after shorting it from 20c, it did found a bottom and now after moving up and breaking out, its time to make a TA play and long the retest of the breakout.

ARCUSDT LONG IDEAhi all. when we look at the arcusdt chart, we can see that price dropped hard in the last two weeks. it seems that price trying to recover. EMA breakout on 1h chart almost happened. also price seems accumulating in the box.i expect price at least touches 50 EMA on 4h timeframe chart. so we can setup long position ;
entry : 0.06366
stop : 0.05895
target: 0.07500 (50 EMA on 4h timeframe)

#ARCUSDT is showing signs of reversal📉 Short BYBIT:ARCUSDT.P from $0.06780
🛡 Stop loss $0.07117
🕒 1H Timeframe
⚡️ Overview:
➡️ The main POC (Point of Control) is at 0.05873, indicating the area with the highest trading volume.
➡️ The 0.07117 level acts as strong resistance where the price previously reversed.
➡️ The chart shows a potential topping structure followed by a decline.
➡️ Volume concentration between $0.065 and $0.06210 suggests key zones for potential profit-taking.
🎯 TP Targets:
💎 TP 1: $0.06510
💎 TP 2: $0.06210
💎 TP 3: $0.06050
📢 Watch the key levels and enter after confirmation!
📢 The price has already started to move down — downside momentum remains strong.
📢 The TP levels are near a previous consolidation zone, allowing quick target execution.
BYBIT:ARCUSDT.P is showing signs of reversal — considering shorts with clear downside targets!

Potential Head and Shoulders Pattern on ARCSOL/USDTTimeframe: 1H | Exchange: MEXC
Date: March 23, 2025
Hey traders! 👋
Spotted a possible Head and Shoulders pattern forming on ARCSOL/USDT. 👀
Left Shoulder: Around 0.0503
Head: Bottomed out at 0.0415
Right Shoulder: Currently forming near 0.0471
This pattern is typically a bearish reversal signal, especially after an uptrend — which we’ve seen over the past few days. If price breaks below the neckline (around the 0.047 region), we could see further downside. 📉
🧩 Supporting indicators:
Momentum indicators are cooling off
Stochastic RSI is showing potential for a downtrend continuation
Bearish divergence on oscillators
Volume declining on the right shoulder — a classic sign 👌
🚨 Key levels to watch:
Neckline support: ~0.047
Breakout target (if confirmed): ~0.038–0.040 zone
Invalidation: Break above 0.055 with strong volume
Not financial advice — just sharing what I see. Stay sharp and manage risk! 🛡️
What’s your take? Comment below! 💬
#ARCSOL #USDT #CryptoTrading #HeadAndShoulders #ChartAnalysis #TechnicalAnalysis #CryptoTA #TradingView

Inverse Head & Shoulders Pattern on ARCSOL/USDTChart Timeframe: 1H | Exchange: MEXC
📅 March 23, 2025
This setup is looking textbook bullish! A clean Inverse Head and Shoulders has printed, backed by volume and momentum confluence.
📐 Pattern Anatomy:
Left Shoulder: ~$0.0503
Head (Major Low): ~$0.0415
Right Shoulder: ~$0.0471
Neckline Breakout Zone: ~$0.055
Measured Target: $0.098 USDT
✅ Pattern Confirmations:
Broke downtrend with bullish divergence
Volume spike on neckline test
Laguerre + Cipher confirming upward momentum
Bullish market structure shift post right shoulder
Falling wedge breakout led into head formation — added confluence 🔥
💥 Next Steps:
Watch for support confirmation at $0.055 — a retest with bounce would be ideal before targeting the full move to $0.098.
🎯 Potential Trade Setup (not financial advice):
Entry: Break & retest of neckline
TP: $0.098
SL: Below right shoulder ~$0.0465
This is a powerful reversal signal after a prolonged downtrend — eyes on volume and momentum follow-through.
What do you think? Is this the start of a major shift for $ARCSOL?
👇 Drop your analysis in the comments!
#ARCSOL #InverseHeadAndShoulders #CryptoBreakout #AltcoinSeason #TA #CryptoCharts #TradingView #ReversalSetup

ARC ANALYSIS🔮 #ARC Analysis
💲💲 #ARC is trading in a Symmetrical Triangle Pattern. If the price of #ARC breaks and sustain the higher price then will see a pump. Also there is an strong support zone. We may see a retest towards the support zone first and then a reversal📈
⁉️ What to do?
- We have marked crucial levels in the chart . We can trade according to the chart and make some profits. 🚀
#ARC #Cryptocurrency #Support #Resistance #DYOR

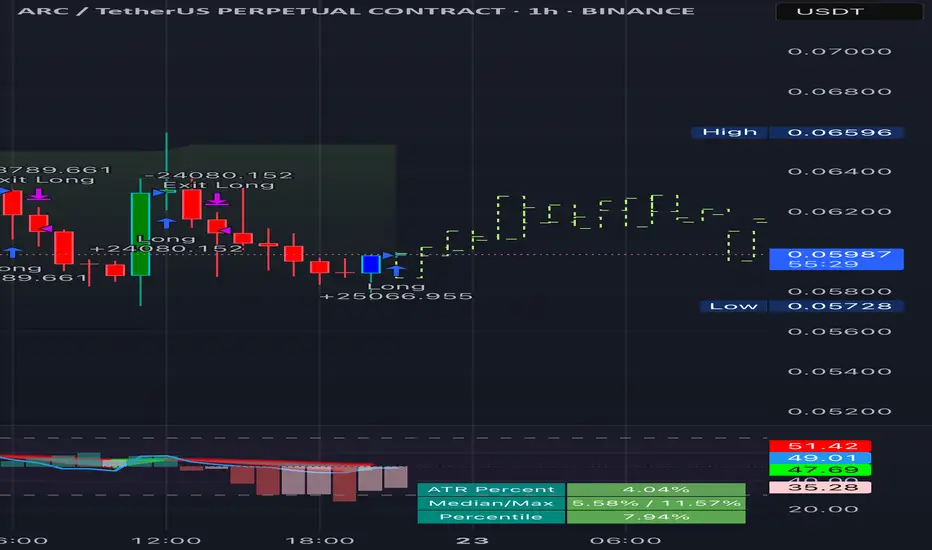
ARC/USDT - Elliott Wave Completion and ABC Correction ExpectedThe ARC/USDT perpetual contract on Binance has completed a classic 5-wave Elliott impulse pattern, peaking at wave (5). Based on Elliott Wave Theory, a corrective ABC pattern is expected, with wave A initiating a decline.
Entry: Short position near wave (5) peak
Target: Wave C completion zone around 0.056
Stop Loss: Above recent high near 0.0817
The retracement aligns with Fibonacci levels and prior support zones, suggesting a potential pullback before further trend continuation. Manage risk accordingly.

Bullish pattern signalThere is a short-term bullish pattern forming, indicating a potential profit target of 2% upon reaching it. It's important to closely monitor the liquidity in the market, as fluctuations could impact price movement significantly. Keep an eye on trading volumes and support levels to gauge the strength of this bullish signal.
Trading opportunity for AI Rig Complex ARCUSDTBased on technical factors there is a Buy position in :
📊 ARCUSDT
🔵 Buy Now
🪫Stop loss 0.0450
🔋Target 0.0990
📏 R/R 2,7
💸RISK : 1%
We hope it is profitable for you ❤️
Please support our activity with your likes👍 and comments📝
Trading opportunity for ARCUSDTBased on technical factors there is a Buy position in :
📊 ARCUSDT
🔵 Buy Now
🪫Stop loss 0.0310
🔋Target 0.0600
📏 R/R 1,8
💸RISK : 1%
We hope it is profitable for you ❤️
Please support our activity with your likes👍 and comments📝

Nothing fancy bidding supp/demand zone Got front runned 2 times on this so lets see
trade chances are likely to hit sl cuz of this massive move down on both arcsol and following btc
lets see

Bullish Opportunity in ARC (Binance Futures)1. We have structure of the parent model 22
2. We have a run on buyside within the H1 discount lows
3. We have buyside to attack

Bearish opportunity in ARC (Binance Futures)1. Price has rejected off the rejection block order-block
2. We have CISD therefore confirming order-flow
3. We have price rejecting off the entry FVG

KEY LEVEL FOR THIS CRYPTOARCUSDT is hitting a strong resistance at around 0.25. If this level is strong enough , we could see a downside continuation to 0.1730 for a RR 1:2 trade setup .

ARC Bullish Reversal? Perfect Harmonic Setup + Break of LHs#ARC has been in a downtrend, but a perfect harmonic pattern has now formed on the 2H timeframe, signaling a potential bullish move.
Key Bullish Signs:
✅ #Harmonic Pattern Completion
✅ Bullish Divergence on #RSI
✅ Break of Previous #LHs (Sign of Reversal)
✅ Strong Support Zone Identified
🔥 Trading Plan: Long at CMP with SL below the harmonic low. TP1, TP2 and TP3 marked on the chart.
💬 What do you think? Are we ready for a bullish breakout? Drop your thoughts below! 👇👇

Can someone help me out with ARC?I'm trying to find out where we are in the elliot wave count. My idea is that we are in wave 5 of wave I. But we keep going up. I want to buy at the bottom of wave 2.

#ARCUSDT - Monitor this asset closely📈 LONG BYBIT:ARCUSDT.P from $0.25588
🛡 Stop Loss: $0.24176
⏱️ 1H Timeframe
✅ Overview:
➡️ BYBIT:ARCUSDT.P has broken out of a Falling Wedge pattern and is following an upward trend.
➡️ The POC (Point of Control) at $0.24041 confirms liquidity in this zone, potentially acting as strong support.
➡️ The key resistance is at $0.25588; if the price holds above this level, it may lead to further gains.
➡️ Increased volume signals strong buyer activity and a high probability of continuation.
⚡️ Plan:
➡️ Important: Set an order in advance to ensure execution when the price reaches the entry level!
➡️ Enter long above $0.25588.
➡️ Stop-Loss placed at $0.24176 for risk management.
🎯 TP Targets:
💎 TP1: $0.26618
🔥 TP2: $0.27640
⚡️ TP3: $0.28670
🚀 BYBIT:ARCUSDT.P - Monitor this asset closely!
🚀 Place your order in the listing so that it executes automatically when the breakout occurs.

ARC Long 1:20 RRArc has had a significant pullback and is resting at a strong low expecting a 1:19 risk to reward trade.

ARC analysis (4H)From the point where we placed the red arrow on the chart, it seems that ARC's correction has begun.
Based on the correction, a 3D pattern appears to be forming, with the third drive potentially completing in the green zone, where we can look for buy/long positions.
In this area, upon receiving a trigger, sell/short positions can also be considered.
For risk management, please don't forget stop loss and capital management
Comment if you have any questions
Thank You

ARCUSDT: Trade Plan.ARC is moving in side ways and currently we have 2 plans of trade long and short.
1st Trade: BUY/LONG
We can buy on CMP, which is the 0.618 level of the FIB and this is the Gold Zone for the Entry and we will take trade on the double top.
2nd Trade: SELL/SHORT
We can short the trade after the double top confirmation. and wait for the any bearish candle appear on the chart.
