Ardor | Boring, Exciting, Repetitive? (260% Potential)It is clear now that Ardor (ARDRBTC) is going bullish, this is shown on the chart by the breakout from the reversal pattern as well as the volume. And people are wondering, is this boring? Is it exciting? Is it getting repetitive?
➖ I'll tell you what, it is not boring for those getting paid.
➖ It
Related coins

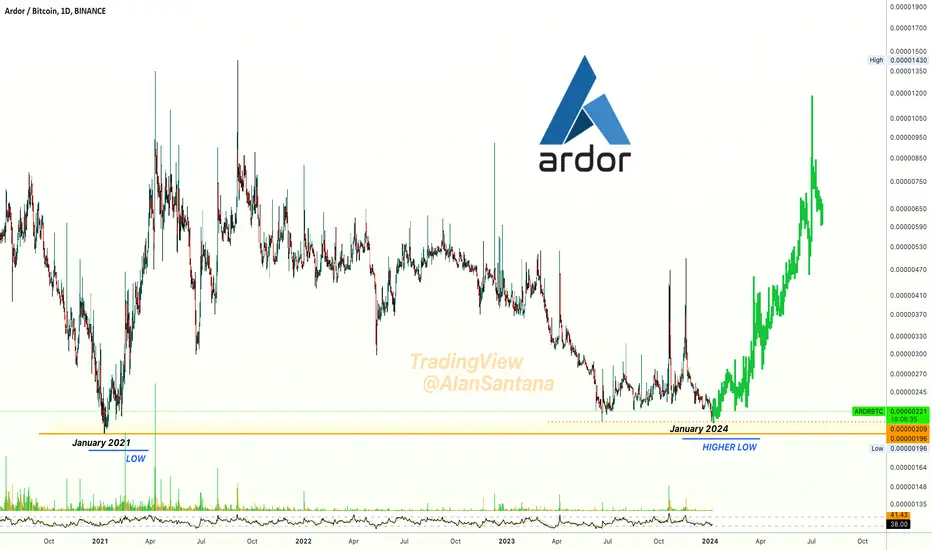
Ardor Goes BullishHere we have a pair that is moving bullish just as Bitcoin is moving bearish: ARDRBTC.
➖ We can see a low 18-June with a reversal candle, and a higher low 5-July with an even stronger reversal candle.
➖ Today we can see a full green candle coupled with a volume breakout.
This can be one of those

✴️ Ardor Hit Bottom On This Date 3 Years AgoAnd three years later we have a long-term higher low; January 2024 vs January 2021.
I can see a massive bullish wave coming up next but it won't end up as a lower high, it will reach a new All-Time High by the time the bull-market is in full force, it will be something to experience, the numbers wi
✳️ Ardor | Multiple Bullish Confirmations (Easy 125% Potential) Many signals already fully confirmed on this pair: ARDRBTC (Ardor vs Bitcoin).
All these are part of our set of "classic signals".
We've been using these signals successfully since 2017 and this a good mention now because we've been trading Ardor long-term as well.
The potential is huge and the ta

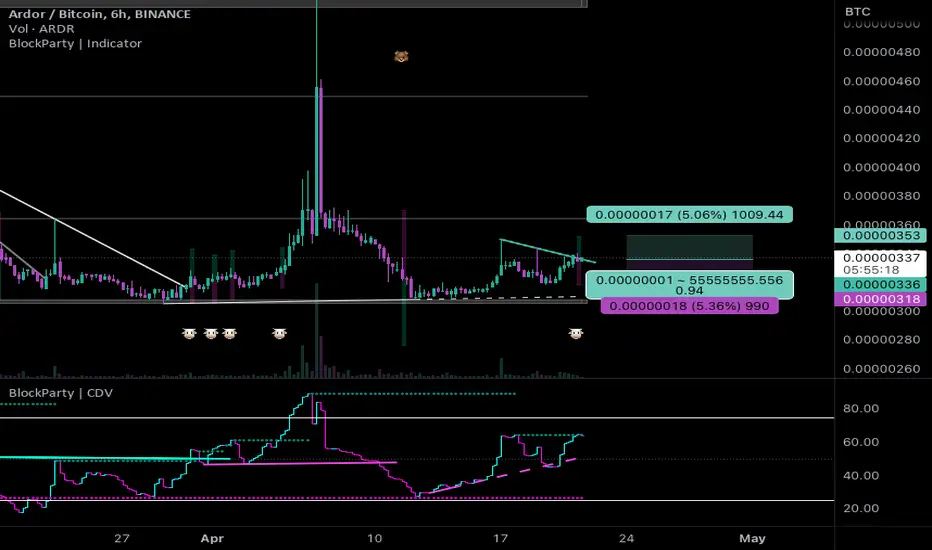
#ARDR/BTC - Long - Potential 5.06%Direction: Long
Market: Spot
Risk: 0.25% - 1%
#BTC_ARDR
Exchange: BINANCE
Timeframe: 360
TP1: 0.00000352
Entry: 0.00000335
STOP: 0.00000318
Entry Conditions:
| Trendbreak
| CVD break
$ARDR/#BTC [#Ardor]: BBand_Breakout Super-TrendOn the $ARDR / $BTC chart, we can see a Bollinger Band breakout and a Super Trend pattern. Both indicators are indicating a bullish trend, with the Bollinger Band indicating a probable positive trend as the price has moved outside of the upper band and the Super Trend indicating a bullish trend. Bec

#ARDR/BTC [Ardor]: Resistance_Breakout_+_ConfirmationWe've detected a Resistance Breakout and Confirmation on the ARDR/BTC chart. The price has broken above a key resistance level and has been confirmed by a strong candle, indicating a potential bullish trend. We may consider buying at the current price zone and targetting higher level.

Ardor (ARDR) formed bullish Cypher for upto 27.5% pumpHi dear friends, hope you are well and welcome to the new trade setup of the Ardor (ARDR) coin.
On a 4-hr time frame chart, ARDR has formed a bullish Cypher pattern.

Ardor Weekly Reversal Pattern Can Print 270% Growth!The weekly candle will close in less than 12 hours, once this candle closes a bullish pattern can form if ARDRBTC closes above 0.00000545 (or EMA50).
For confirmation, we need this and next weeks candle to close.
On this chart we have the support levels marked (blue) and also the targets (grey/yel

This only for public signal, anything just pm me thanks.This only for public signal, anything just pm me thanks.

See all ideas
Summarizing what the indicators are suggesting.
Oscillators
Neutral
SellBuy
Strong sellStrong buy
Strong sellSellNeutralBuyStrong buy
Oscillators
Neutral
SellBuy
Strong sellStrong buy
Strong sellSellNeutralBuyStrong buy
Summary
Neutral
SellBuy
Strong sellStrong buy
Strong sellSellNeutralBuyStrong buy
Summary
Neutral
SellBuy
Strong sellStrong buy
Strong sellSellNeutralBuyStrong buy
Summary
Neutral
SellBuy
Strong sellStrong buy
Strong sellSellNeutralBuyStrong buy
Moving Averages
Neutral
SellBuy
Strong sellStrong buy
Strong sellSellNeutralBuyStrong buy
Moving Averages
Neutral
SellBuy
Strong sellStrong buy
Strong sellSellNeutralBuyStrong buy
Displays a symbol's price movements over previous years to identify recurring trends.