Ardor | Boring, Exciting, Repetitive? (260% Potential)It is clear now that Ardor (ARDRBTC) is going bullish, this is shown on the chart by the breakout from the reversal pattern as well as the volume. And people are wondering, is this boring? Is it exciting? Is it getting repetitive?
➖ I'll tell you what, it is not boring for those getting paid.
➖ It is excitement for those buying in.
➖ It is repetitive for those seeing the opportunity but not being able to jump in...
Good evening my dear supporter, it is my pleasure to write for you again.
This is another bullish pair and it tends to move fast and strong.
These targets can be hit within a few short months, sometimes faster.
Everything is pointing to 1-3 months total for high targets to be hit, but it can develop much sooner in some cases; patience is key.
These will grow while Bitcoin ends its correction.
They will continue to grow as Bitcoin recovers.
👉 The entire Cryptocurrency market will grow in late 2024 and all throughout 2025... So prepare, we are only getting started. I shall entertain you for years to come.
Thanks a lot for your continued support.
Namaste.
ARDRBTC trade ideas

Ardor Goes BullishHere we have a pair that is moving bullish just as Bitcoin is moving bearish: ARDRBTC.
➖ We can see a low 18-June with a reversal candle, and a higher low 5-July with an even stronger reversal candle.
➖ Today we can see a full green candle coupled with a volume breakout.
This can be one of those pairs that goes green while the correction continues to unravel on the big projects and ALTSUSDT.
Remember, things can change.
Make sure to have an exit plan in case the chart changes course.
Thank you for reading.
Namaste.

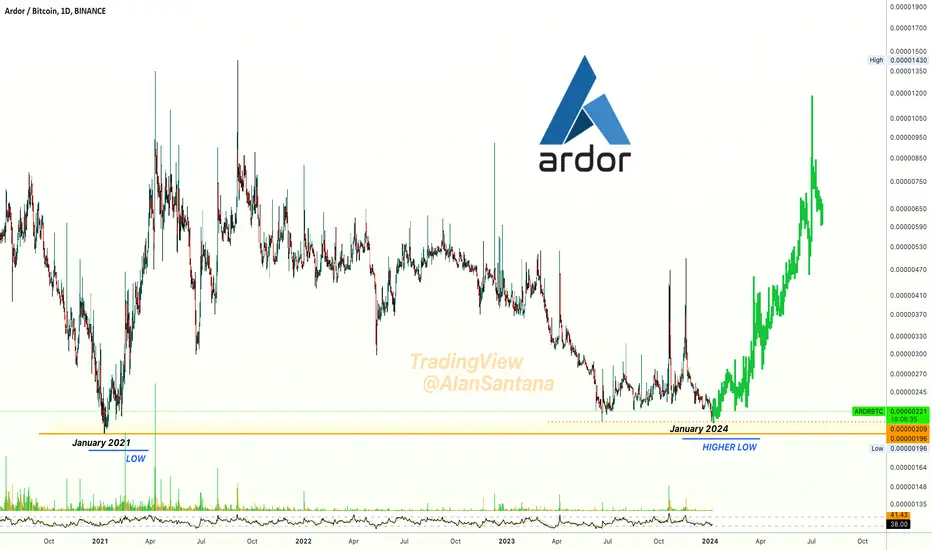
✴️ Ardor Hit Bottom On This Date 3 Years AgoAnd three years later we have a long-term higher low; January 2024 vs January 2021.
I can see a massive bullish wave coming up next but it won't end up as a lower high, it will reach a new All-Time High by the time the bull-market is in full force, it will be something to experience, the numbers will go off-the-chart.
Notice how the RSI here is still trading at 38, pretty weak.
I mention this so you can understand why it is a bullish signal when the RSI is strong (above 50) near support.
Regardless of the RSI, Ardor is part of the Cryptocurrency market and the entire market is set to grow in 2024 and beyond.
Namaste.
✳️ Ardor | Multiple Bullish Confirmations (Easy 125% Potential) Many signals already fully confirmed on this pair: ARDRBTC (Ardor vs Bitcoin).
All these are part of our set of "classic signals".
We've been using these signals successfully since 2017 and this a good mention now because we've been trading Ardor long-term as well.
The potential is huge and the targets can be seen on the chart.
Now, let's mention some of those signals.
Trading above EMA21 & EMA10.
Trading above EMA50 and EMA100 (today).
MACD now trading above zero.
Very strong RSI.
Full green candle yesterday.
Bullish candle today (long lower wick, filled green real body).
Rising volume. Bull volume predominant throughout the year.
This is great.
I am wishing you great profits, health, wealth and success.
You deserve the best, now & always.
Namaste.

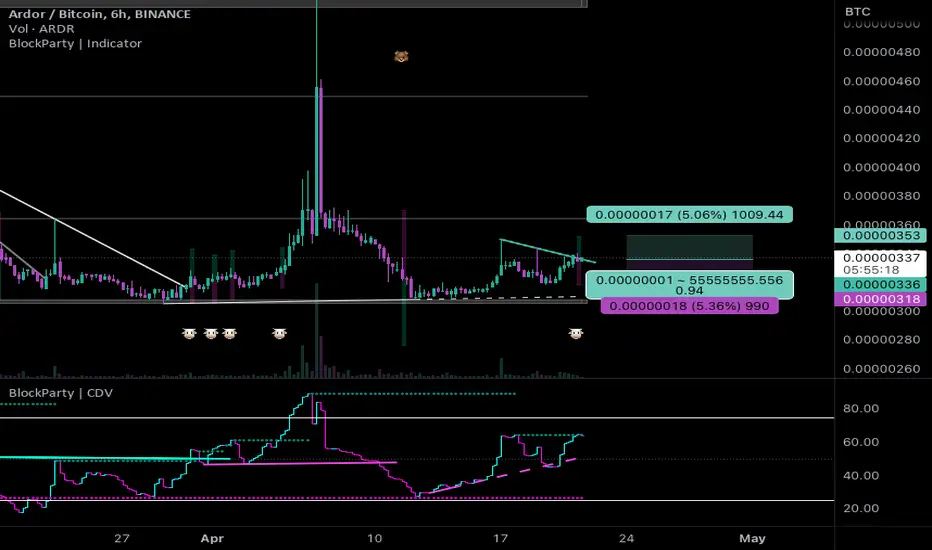
#ARDR/BTC - Long - Potential 5.06%Direction: Long
Market: Spot
Risk: 0.25% - 1%
#BTC_ARDR
Exchange: BINANCE
Timeframe: 360
TP1: 0.00000352
Entry: 0.00000335
STOP: 0.00000318
Entry Conditions:
| Trendbreak
| CVD break
$ARDR/#BTC [#Ardor]: BBand_Breakout Super-TrendOn the $ARDR / $BTC chart, we can see a Bollinger Band breakout and a Super Trend pattern. Both indicators are indicating a bullish trend, with the Bollinger Band indicating a probable positive trend as the price has moved outside of the upper band and the Super Trend indicating a bullish trend. Because both indicators are in sync, this is a stronger bullish indication. To buy at the current price range and aim for higher levels would be a solid option. Our analysis indicates that the key resistance levels are at 0.00000465 | 0.00000497 | 0.00000552 and the major support zones are at 0.0000041 | 0.00000387 | 0.00000332.
Technical Metrics :
Current price: 0.00000413
24H Volume: 3.4779 Ƀ
24H Price change: 0.243%
- Pivot Points - Levels :
Resistance: 0.00000465 | 0.00000497 | 0.00000552
Support: 0.0000041 | 0.00000387 | 0.00000332
Indicators recommandation :
Oscillators: NEUTRAL
Moving Averages: NEUTRAL
Technical Indicators Summary : NEUTRAL
- In-depth ARDRBTC technical analysis on > Tradingview TA page
What do you think of this analysis? Share your insights and let's discuss in the comments below. Your like, follow and support would be greatly appreciated!
Welcome to the home of charting big: TradingView
Benefit from a ton of financial analysis features, instruments and data. Have a look around, and if you do choose to go with an upgraded plan, you'll get up to $30.
Discover it here

#ARDR/BTC [Ardor]: Resistance_Breakout_+_ConfirmationWe've detected a Resistance Breakout and Confirmation on the ARDR/BTC chart. The price has broken above a key resistance level and has been confirmed by a strong candle, indicating a potential bullish trend. We may consider buying at the current price zone and targetting higher level.

Ardor (ARDR) formed bullish Cypher for upto 27.5% pumpHi dear friends, hope you are well and welcome to the new trade setup of the Ardor (ARDR) coin.
On a 4-hr time frame chart, ARDR has formed a bullish Cypher pattern.

Ardor Weekly Reversal Pattern Can Print 270% Growth!The weekly candle will close in less than 12 hours, once this candle closes a bullish pattern can form if ARDRBTC closes above 0.00000545 (or EMA50).
For confirmation, we need this and next weeks candle to close.
On this chart we have the support levels marked (blue) and also the targets (grey/yellow).
You can leave a comment if you have any questions or revise the chart for additional information.
3000%+ to ATH:
Thanks a lot for your support.
Namaste.

This only for public signal, anything just pm me thanks.This only for public signal, anything just pm me thanks.

Ardor buy signalARDR is looking pretty bullish
Target : 00001111
What is ARDR?
ARDR is the cryptocurrency that powers the Ardor Platform. The Ardor Blockchain-as-a-Service Platform was created by Jelurida using the proven features of the solid, reliable Nxt blockchain technology.


Crypto|ARDR/BTC|LongLong ARDR/BTC
Activation of the transaction only when the blue zone is fixed/broken.
The author recommends the use of anchoring fixed the blue zone, this variation is less risky.
If there is increased volatility in the market and the price is held for more than 2-3 minutes behind the activation zone after the breakdown, then the activation of the idea occurs at the prices behind the activation zone.
The idea is to work out the resistance level .
* Possible closing of a trade before reaching the take/stop zone. The author can close the deal for subjective reasons, this does not completely cancel the idea and is not a call to the same action, you can continue working out the idea according to your data, but without the support of the author.
+ Maybe right now we will go even lower, then it's okay, the idea is not activated and simply canceled.
+ ! - zone highlighted by the ellipse is a zone of increased resistance, in this area there is a possible reversal for a correction, please take this factor into account in this transaction.
The "forecast" tool is used for more noticeable display of % (for the place of the usual % scale) of the price change, I do not put the date and time of the transaction, only %.
Blue zones - activation zones.
Green zones - take zones.
Red zone - stop zone.
Working out the stop when the price returns to the level after activation + fixing in the red zone.
Orange arrow - the direction of take.
The red arrow - the direction of the stop.
SUM PNL: This parameter displays the total % of all closed ideas of the "new" format (according to the author) for this sector at the time of publication of the idea. The calculation is very "clumsy" just the sum of the profits of all the ideas, based on this indicator, you can more accurately assess the risks when working with my ideas of this sector. I present you the construction of the idea, you can use it yourself as you like based on your subjective view and risks, the calculation of the PNL indicator is carried out only on transactions that the author closed on TV in manual mode or by take.
P.S Please use RM (risk management) and MM (money management) if you decide to use my ideas, there will always be unprofitable ideas, this will definitely happen, the goal of the system is that there will be more profitable ideas at a distance.

ARDRBTC - Long - Potential 11.14%ARDRBTC - Long - Potential 11.14%
Exchanges: Binance
Signal Type: Regular (Long)
Entry Zone:
0.00000671 - 0.00000692
Take-Profit Targets:
1) 0.00000715
2) 0.00000769
Stop Targets:
1) 0.00000640
Trailing Configuration:
Entry: Percentage (0.0%)

Crypto|ARDR/BTC|Long and shortLong and short ARDR/BTC
Activation of the transaction only when the blue zone is fixed/broken.
The author recommends the use of anchoring fixed the blue zone, this variation is less risky.
If there is increased volatility in the market and the price is held for more than 2-3 minutes behind the activation zone after the breakdown, then the activation of the idea occurs at the prices behind the activation zone.
Working out the support and resistance levels of the consolidation zone.
* Possible closing of a trade before reaching the take/stop zone. The author can close the deal for subjective reasons, this does not completely cancel the idea and is not a call to the same action, you can continue working out the idea according to your data, but without the support of the author.
+ ! - zone highlighted by the ellipse is a zone of increased resistance, in this area there is a possible reversal for a correction, please take this factor into account in this transaction.
The "forecast" tool is used for more noticeable display of % (for the place of the usual % scale) of the price change, I do not put the date and time of the transaction, only %.
The breakdown of the upper blue zone - long.
Breakdown of the lower blue zone - short.
Working out the stop when the price returns to the level after activation + fixing in the red zone.
Blue zones - activation zones.
Green zone - take zone.
Red zone - stop zone.
Orange arrows indicate the direction of the take.
Red arrows indicate the direction of the stop.
Priority - The value of the priority parameter implies the author's subjective opinion about the more likely activation zone on this idea, this does not mean that this idea will be 80% activated by this parameter, the purpose of the parameter is to provide for the risk of the inverse of the zone parameter.
Example: "Priority Long: So the author inclines more in the direction of the activation zone open long trades, in this case, when reaching the activation zone in short you should be very careful, because this area may be highly likely to be punched about the breakdown/do not get to take/activate transaction from go to stop."
Please consider this parameter if you use my ideas.
SUM PNL: This parameter displays the total % of all closed ideas of the "new" format (according to the author) for this sector at the time of publication of the idea. The calculation is very "clumsy" just the sum of the profits of all the ideas, based on this indicator, you can more accurately assess the risks when working with my ideas of this sector. I present you the construction of the idea, you can use it yourself as you like based on your subjective view and risks, the calculation of the PNL indicator is carried out only on transactions that the author closed on TV in manual mode or by take.
P.S Please use RM (risk management) and MM (money management) if you decide to use my ideas, there will always be unprofitable ideas, this will definitely happen, the goal of the system is that there will be more profitable ideas at a distance.


IDEANot a Trade advice
Hey huys!
here is my opinion about the technical analise
as we can see we are right now inside of the daily channel and at the same time experiencinga an up trend movement( bullish movment)
inside of the daily channel we can see right now a bullish flag. and at the same time, we are testing the last resistance as a new support
noting that this new support we are testing is the lever 0.618 fi bonacci
just waiting for a candle pattern and confirmation to set a long order


50% for ARDR? yes, patience is the keyThis is not a financial advice. Always do your own research and always put stoploss in your trade (SL) :) If you want more detailed info how to study and read charts or just need help with some coin, just write to me here personal message, i will try to answer to everybody... i can help you :) all for free, don't worry, BE HAPPY!
If u like the analysis, please feel free to ask any question about this TA or crypto or any coin and also leave a comment or like or share the idea, i really appreciate it because then my work makes sense :) thanks!

ARDRBTC is testing the daily resistance 🦐ARDRBTC is testing the daily resistance. The price is forming an inverse head and shoulder. IF the price will have a breakout from the neckline and retest it as new support, According to Plancton's strategy (check our Academy), we can set a nice order
–––––
Follow the Shrimp 🦐
Keep in mind.
🟣 Purple structure -> Monthly structure.
🔴 Red structure -> Weekly structure.
🔵 Blue structure -> Daily structure.
🟡 Yellow structure -> 4h structure.
⚫️ Black structure -> <4h structure.
Here is the Plancton0618 technical analysis, please comment below if you have any question.
The ENTRY in the market will be taken only if the condition of the Plancton0618 strategy will trigger.

ARDR/BTC I am INVESTOR))Back in 2018, there was a number of investments, by the example of which we can see how the market behaves, and what to do when you became an investor
This entry point seemed ideal, but the market made its own adjustments and we went into a downtrend for 2.5 years
The position was entered at 0.45 BTC, which is the equivalent of $ 4500 at that time, and the instrument fell by 95% and only now, against the background of the hype, shows at least some movements
1) Buy only with your own money
2) If you took the shoulder - be sure to stop
3) If you took Short - set stop to 100% and double-check
In 2021 we will collect our funds and gain invaluable experience, which I share with you.
Market crash is inevitable, keep profits, get rid of losses right away, and share risks

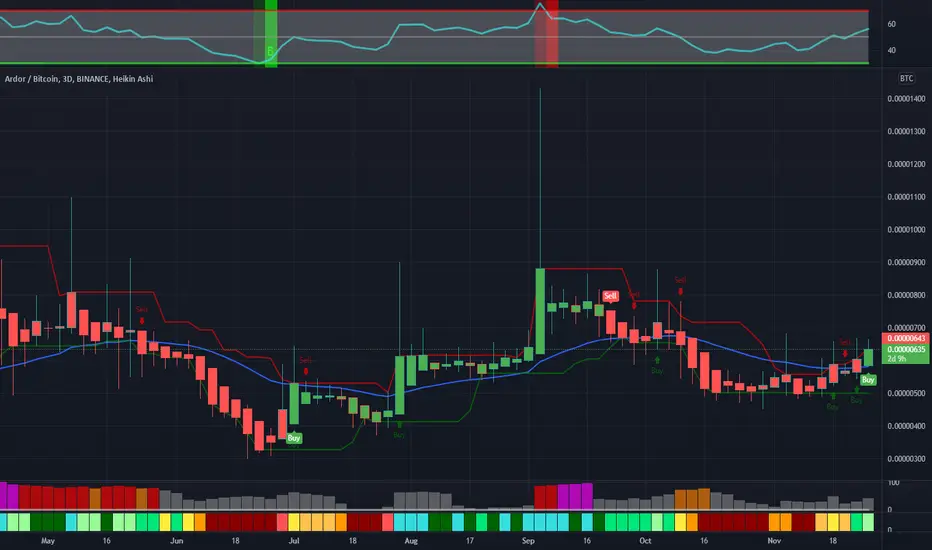
Ardor (ARDR) Breaks Resistance, Next Target Mapped!Today we have a huge volume bar for ARDRBTC (Ardor) to break above the EMA100 blue line... This is great news.
Each time we see a strong resistance level taken out on high volume, this is a signal that favors the bulls.
The MACD is trending up strong while the RSI is now above 73, signaling that the bulls are being favored.
On this current move, ARDRBTC found resistance around 440 satoshis...
On the next move, we are likely to hit 680 or more...
Additional details on the chart.
Namaste.
