Ardor Trading IdeaIf we look at the daily chart of Ardor, we can see that the market is at the support zone. Price bounced from 0.000030 support level and diverged with RSI. We have a reversal signal based on a bullish divergence.
We can open long trades above 0.000029 level with stop orders below 0.000027 support level.
ARDRBTC trade ideas

ArdrArdr
bounced from weekly support have clear way to his resistance at 0.00006993
stop limit under support level
risk about 30 % from current price at 0.00003850
reward about 80 %
capital management is recommended
we ask Allah reconcile and repay

ARDR ideaHello guys,
On the basis of the chart and the current news regarding to NXT, I guess, that Ardor will have a steady growth along the support line until Christmas.
Suggestions for improvement are highly appreciated.
Best regards
NenneBit


ARDR/BTCPosting many charts for cryptocurrencies so I can later on see what I thought at the time, and what happened to the price

ardr possile break outperfect retracement wave into a textbook bottom. took a small early entry to challenge the bottom reversal, first challenge entry at 3180 entry. wait for confirmation on full candle break out @ 3360 and possibly more volume
input always welcome

ARDR/BTC with many upcoming news!Testing support after breakout!
- 24. November Final Ardor Testnet Release
- 25. December Ardor Genesis Snapshot
- 27. December Ardor Software Release (Mainnet launch)

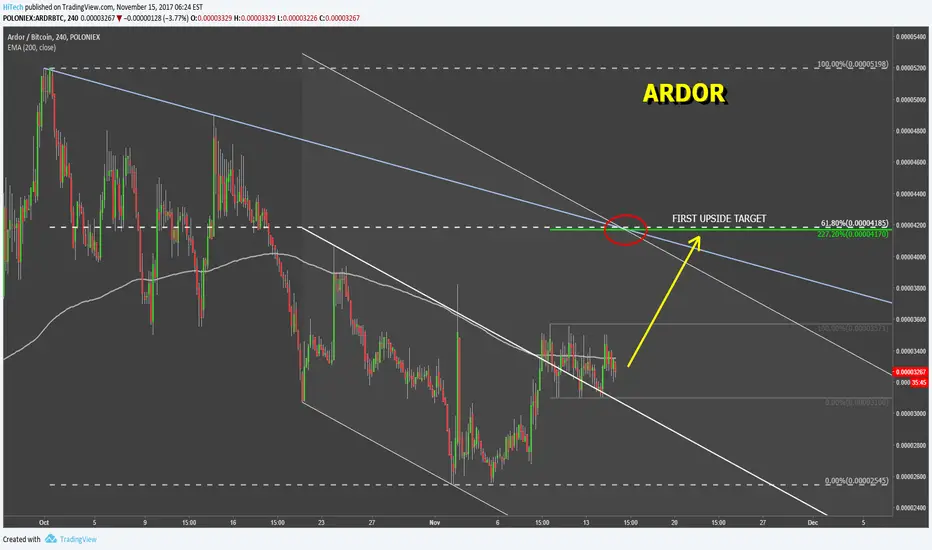
Ardor Is a Favorite Against BitcoinArdor found the support at 2545 satoshi on the 2nd of November. After a corrective wave up it came down, testing and rejecting the same support once again, forming a double bottom.
The following wave up resulted in the break above the descending channel as well as 200 Moving Average suggesting that the trend could be changing from bearish to bullish.
Fibonacci applied to the corrective wave after the resistance breakout shows that at 227.2% retracement at 4170 satoshi a strong resistance is formed and it is corresponding with 61.8$ Fibonacci retracement applied to the 1st of October high and 2nd of November low.
It is highly likely that ADR/BTC will move towards that level and it would be interesting to see the reaction there, whether it will break above or reject this target. Break above should result in more growth. At the same time break below the 2445 satoshi should invalidate this bullish outlook and potentially send Ardor lower.
Ardor attempt to break downward channelIf Ardor has enough support here it could break from this downward channel.

ARDR BTC Daily and 4hr chart 18th Nov 2017Quick TA on ARDR
we got some fundamental news with NXT/IGNIS, ARDR looking to be a strong player into 2018
there is a strong support shown by the red line and the Gann fan
looks like a triangle forming on the 4hour chart and expect to play within this before breaking out

Back to acumulation zoneNow you may have another good oportunity to get some ARDR at good price before next month launch of the main net. Personally i think ardr is a project with a team with reliable trackrecord, an interestng product and lack or poor PR strategy. All of this is good as we are at firsts steps of crytpo and first steps of ARDR. You can find more information at www.ardorplatform.org never do things blindly.
About the chart: MACD suggest more downside movement and the horizontal support has proven to be strong (trend line is probably useless). I've been acumulating on bounces on the strong horizontal support and it's been working fine so long.
You can see here ARDR/USD
Some kind of triangle or ascending triangle with support building and accumulation taking place that suggests a big move at the end of the year (when mainnet will launch)

ARDOR wih suzuki IGNIS soonlook the fundermental is great. hopefully it will be nice.
to see ARDOR around wih the IGNIS.
hope to see u soon ARDOR.

Long Term ARDRBTCI guess, the next resistance will be very strong for ARDRBTC. Let's see what will happen.


ARDOR - Last Stand
The correction came down to the 88% fib. Retracement level and is no moving inside a triangle, currently sitting at the support line.
The daily chart shows an oversold RSI heading upwards and a slightly dropping MACD indicator. The volume decreased, which might be a sign for tired bears.
The 4h chart shows that the market closed below the Bollinger Bands, even the last dip closed below it. MACD is showing bearish downwards, RSI is oversold.
The big question is, if the support holds and the bulls are coming back to push the market.
A good signal would be a closing inside the Bollinger Bands and crossing MACD.
If the support breaks, next support is around 3000 and then 2700.
If we are staying above the trendline, the retest of the downtrendchannel is likely at around 3400.

ARDR - Possible Ending ActionPrice movement to the downside hit the long term resistance line and bounced. Weak volume possibly indicating sellers are tired. Possible ending action. Expect volume to rise significantly if we enter the top half of former trading range (marked as the higher rectangle in blue) as a sign of strength - spring action still a bit weak, look for good volume to the upside for a safer entry. However, note that once supply is truly exhausted, the slightest amount of demand can trigger a move to the upside due to lack of supply. Careful with your stops, final attempts at accumulation could be the name of this game.

ARDR in acumulation zonePrice entered an area of strong support and close to an important diagonal resistance.
For long term holding the color boxes are good buying areas. FA suggests that in incoming months the network could take important steps forward.
Price bouncing and holding near any of the lines could be a good entry signal for long term holding strataegy.

ARDORLook like Ascending Flag. ARDRBTC didn't react to the growth of bitcoin. Now we see volatility. And waiting for break out resistance line of Flag

Time for trend reversal? Triple ottom on ARDRBTCARDR has been going sideways for a couple of weeks now, could this be the moment which changes it all? Just pure speculation but it sure looks like it. Symmetric triangle and triple bottom.

ARDRBTC - Where Now?While indicators are bearish and sell volume is increasing, there is a cluster of supports around the current price action.
Key levels highlighted using trend lines and moving averages.

ARDR RectanglesCurrently in a higher rectangle - potential attempt at a higher base - bulls could be looking to exhaust sellers either through attrition or price movement one way or the other. Would not be surprised to see a break below the rectangle or at least another move down to yellow major support before a move higher. Resistance is almost futile at this point, but it is cute to watch.

ARDRBTC ralying for a riseBeen watching ARDR for a while now
it has been moving sideways on a RSI wave above the 40 line, but no big moves up
now I see a divergence from the stoch, plus a flag pattern that might be leading to a move up.
regarding to how one calculates the extent of the forthcoming move- I'm not a great believer of Fib retracements.
the Fibonachi ratio is an aesthetic appearance that shows up at hinder sight.
I believe that a coin has a built-in potential that is manifested in direct ratio to the coin volume and trade volume, and clues to that you can get from previous major moves up or down.
I would love to hear what other people have to say about that
peace
A

ARDR breakout on volume within the week to 6k areaFlag pattern appears to be converging near the $BTC.X hardfork. Expect 3 areas of resistance, 5000, 6000 and 7000 satoshis.
