ARDRBTC trade ideas


It’s The Nice Buy Opportunity ❕Impulsive Correction And Breakout Of The Falling Wedge Completed ,It’s The Nice Buy Opportunity
✅ Targets At The Chart
🔴 Stop loss zone : 215 ~ 210

$ARDR Onward and upward.Ardor is looking brilliant on the 1 day charts.
Stochastic RSI, MACD and EMA's all bullish
Yesterday we broke Trend and closed above the 55 day moving average, but at the moment it is below.
Id like to see the Supertrend indicator give us a buying signal. But overall this is nicely building up

ARDRBTCFirst, it needs to come above 2h MA200 that bitcoin bull caused it to drop. Then it will be above 2h MAs again.

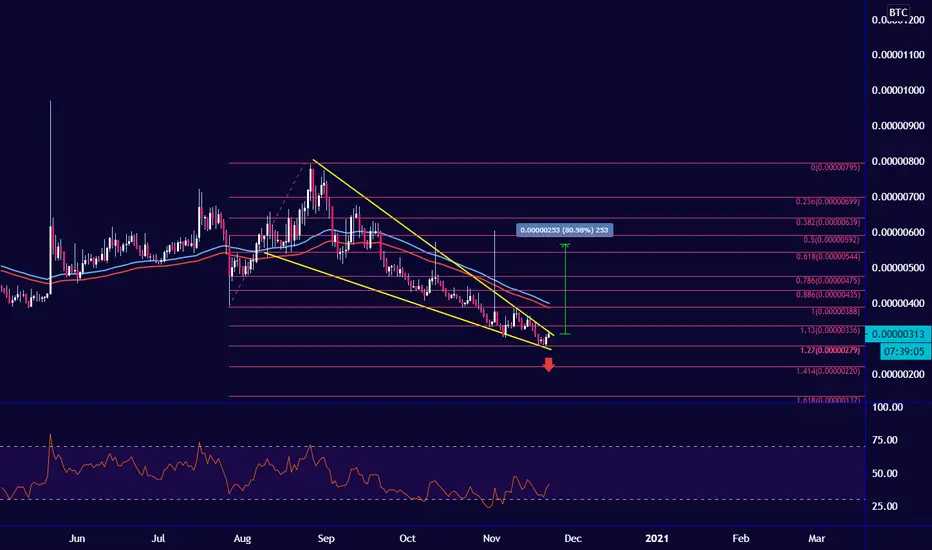
ARDRBTC bullish scenario Potential 100% profitARDRBTC currently trading on a downfall wedge as drawn on the chart. The pair has found support on the bottom of the wedge and now is moving towards
the resistance line. This could be a good entry point with the potential of a breakout to the upside. Huge RSI bullish divergence is in place which makes
the pair extremely confident for upside movement.
As mentioned again, a good entry point would be current market price.
Target 1: around 250 satoshi
Target 2: around 300 satoshi
Target 3: around 400 satoshi
Stop Loss: below the wedge (If any large candlestick close below 180 satoshi)

ARDRBTC - Long - Potential 15.16%ARDRBTC - Long - Potential 15.16%
Entry- 241
TP1- 252
TP2-276
SL- 222
- Key Notes - Sensitive to BTC so monitor BTC Movement - Move SL to at least Buy in at TP1
- RR - 2
- Trailing Buy - 0.5%
- Trailing Profit - 1%
- Trailing Stop-Loss - no


Ardor (ARDR) Super StrongArdor (ARDRBTC) is now at 6 consecutive green candles... Each day we have stronger bullish action taking place.
We can see prices moving above the EMAs.
We can see the daily volume continually increase.
We can see the RSI going up...
We can see the green histogram on the MACD.
ARDRBTC... Is only getting started.
These bullish signals are pointing to something big.
Namaste.

#ARDRBTC (Long Term) 11/20 #ARDRBTC (Long Term)
Buy : 0.00000313 - 0.00000268
Target 1: 0.00000344
Target 2: 0.00000423
Target 3: 0.00000548
Target 4: 0.00000783
Stoploss: 0.00000261
Signal R/R: 10% / 150%
Net ROI : 50%
Invest / Position Size : 3%
Exchange : Binance
Duration: 15-90 days
Confidence in Trade : Low
we ask Allah reconcile and repay.
ARDR clear breakout ARDR has broken the downtrend and ready to fly. The coin has broken the 4-hour downtrend line and holding it well. If there is no sudden pump or dump in BTC, then we see a good return in ARDR.
Buy Range: 340-360 sats
Target: 390-420-460-500 sats
Stop Loss: 315 sats

Ardor Jumps 80%+ After Fake Breakdown...Ardor (ARDRBTC) started moving with great momentum today printing over 80% in growth since yesterday, here we have the classic stop-loss hunt taking place.
Last week we saw prices breaking and closing below support, just to see a very strong bounce take place today.
Moving below support (the May low in this case) activates the stop-loss for traders with an automatic stop-loss in place and thus takes away their money.
If you use manual stop-loss as we do, you can keep your money as you can clearly see prices moving back up.
Anyways, the entire altcoins market will start to rebound and print some very strong bullish/green growth.
Namaste.

ARDRBTC Falling wedge on historical support lineIf consolidation continues along support line we could see the falling wedge validated with new support and prospective breakout


ardr btcformation of saucer pattern in 4hrs
breaking of 512 level is important
formation of decending brodening pattern
in 1 day chart
formation of falling wedge pattern

Growth potential up to 20% in a short timethe price breaks a strong resistance area, an back again to test it, if price can resist, it can rise up again


Ardor Trading Above EMA300, Easy 100%+ MappedArdor (ARDRBTC) is now trading above EMA300/200 as well as MA200, our strongest moving average lines.
What this means is that this pair now stands in bullish territory and can easily move up anytime.
The next target is marked on the chart with a magenta dashed line.
You can find additional targets if you zoom out.
You need your own plan/strategy before you trade.
Make sure to do your own research.
Namaste.
