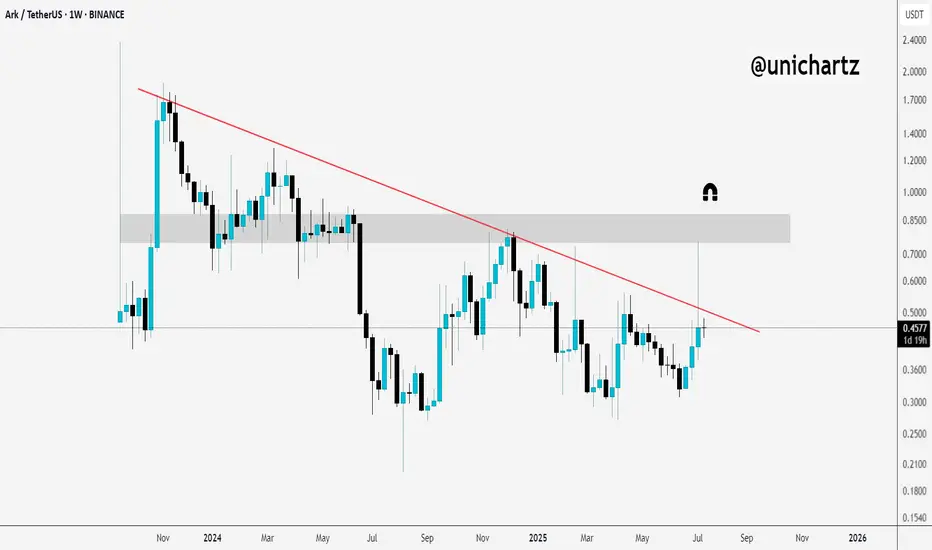
Potential Breakout Setup on ARK/USDT$ARK/USDT Weekly Outlook
Price is currently trading just below the trendline resistance.
If we get a clean breakout and weekly close above it, there’s a good chance we’ll see a move toward the marked resistance zone above.
Add this one to your watchlist — it’s heating up.
DYOR, NFA
ARKUSDT trade ideas
ARKUSDT Forming Bullish PennantARKUSDT is beginning to attract significant attention from traders and investors as fresh buying momentum pushes this pair into the spotlight. With a strong base forming and a healthy increase in volume, ARKUSDT shows signs of strength that could translate into a substantial upside move. Technical traders are watching closely for a breakout above the recent consolidation range, which could easily set the stage for a 40% to 50%+ gain in the coming weeks. The growing interest in this project signals that more participants are positioning themselves for a potential bullish run.
Market sentiment around ARKUSDT is improving as investors look for promising altcoins with solid fundamentals and an active community. The crypto market often rewards early movers, and ARK’s chart structure hints at a possible trend reversal. This pair has managed to hold key support levels with confidence, suggesting that buyers are stepping in to defend the zone and accumulate before the next leg higher. A clean breakout above resistance could invite new capital flows, pushing prices toward the projected target range.
The volume profile for ARKUSDT is another encouraging factor, confirming that the recent price movements are backed by genuine market interest rather than just speculative spikes. This is crucial for sustainability and follow-through, as consistent volume can fuel a steady climb. As altcoins start to gain traction alongside major pairs like BTC and ETH, ARKUSDT stands out as one of the notable opportunities for traders seeking medium-term gains.
✅ Show your support by hitting the like button and
✅ Leaving a comment below! (What is You opinion about this Coin)
Your feedback and engagement keep me inspired to share more insightful market analysis with you!

ARK - a POIHere a POI (yellow mark) for possible Short.
There are good confluences there. 2X Fib and loc-D.
Previously those levels ( loc D and POC) gave us nice Long and Short opportunities.
Here a higher TF :
Follow for more ideas/Signals.💲
Check out my previous TA/Signals which played out nicely. :)
Just donate some of your profit to Animal rights or other charity :)✌️

ARKUSDT - Daily Chart - Elliott Wave AnalysisHere's my refined Elliott Wave count for ARKUSDT, offering a potential roadmap for future price action.
Big Wave A: Completed Bullish Impulse
I've identified a clear five-wave impulse (1-2-3-4-5) that appears to have concluded a significant upward move. The sub-wave analysis shows:
Wave 2: A healthy 61.8% Fibonacci retracement of Wave 1.
Wave 3: A strong extension, reaching 261.8% of Wave 1.
Wave 4: A standard 23.6% Fibonacci retracement of Wave 3.
Wave 5: A less common truncation, failing to surpass the peak of Wave 3.
Overall, this structure suggests a completed motive wave.
Big Wave B: Complex Double Three Correction (W-X-Y)
Following the impulse, the price action has unfolded into a lengthy and deep corrective pattern, which I interpret as a Double Three (W-X-Y).
Wave W: This initial corrective wave shows a deep 'b' wave retracement (78.6%, with significant time extension) and a very deep 'c' wave retracement (300%), which suggests a complex internal structure that warrants further inspection (potentially not a standard corrective three-wave).
Wave X: The connecting wave appears to be a Zigzag, with a deep 'b' wave (78.6% retracement) and an extended 'c' wave (141.4% extension). The overall Wave X retraced 38.2% of the preceding move.
Wave Y: This final corrective wave of the Double Three is a complex structure itself (potentially another Double/Triple Three). Its sub-waves (w, x, y) show various Fibonacci relationships, with the overall Wave Y retracing 78.6% of the move from the start of Wave W to the end of Wave X.
Overall Correction: Big Wave B retraced a significant 78.6% of Big Wave A and took considerably longer to unfold, indicating a strong counter-trend move.
Current Outlook & Potential Big Wave C:
Since the low in late 2024, we've seen a strong bullish move. This suggests that the complex Big Wave B correction has likely completed, and we are now potentially in the early stages of a new bullish impulsive wave – Big Wave C.
Bias: Medium-Term Bullish

Trade Setup: ARK/USDT SHORT🟡 Market Outlook:
Expecting a rejection from the current buy zone due to strong support in that area.
⸻⸻⸻⸻⸻⸻⸻
🔹 Trade Details
• 🔽 Position: Short
• 📍 Entry: 0.5391
• 🎯 Targets:
• TP1: 0.5162
• TP2: 0.4747
• TP3: 0.4246
• 🛑 Stop Loss: 0.5592
⸻⸻⸻⸻⸻⸻⸻
🔁 Risk management is key – adjust position size accordingly.
💬 Feel free to share your thoughts or ask questions.
⸻⸻⸻⸻⸻⸻⸻
🧠 Enhance. Trade. Grow.
📢 Like & follow CIDA Signals for more premium trade ideas and market insights.

2.7 RR tradeLooks like has strong support at the indicated range. Target will change based on price action which has elapsed by the time the entry is hit.


ARKUSDT(Ark) Updated till 17-02-25ARKUSDT(Ark) Daily timeframe range. for low volume and retail interest from this kind of alt very easy to find good R:R setups for day traders. failed to close above 0.5587 will push the price down to 0.3636. it will retrace back if stays above 0.5587.

ARKUSDT: A Green Beacon in a Red Sea? ARKUSDT: A Green Beacon in a Red Sea? 💹
While everything else seems to be sinking, ARKUSDT stands a chance to stay green. However, let’s not get overly optimistic just yet. The green box below is a potentially safer entry zone , depending on market conditions.
Here’s the game plan:
Green Box: A solid area for entries if the market aligns.
Confirmation Required: Always wait for low time frame (LTF) structure breaks before making a move.
Stay sharp, manage your risk, and let the charts guide you. Boost, comment, and follow for more trading insights! 🚀
Let me tell you, this is something special. These insights, these setups—they’re not just good; they’re game-changers. I've spent years refining my approach, and the results speak for themselves. People are always asking, "How do you spot these opportunities?" It’s simple: experience, clarity, and a focus on high-probability moves.
Want to know how I use heatmaps, cumulative volume delta, and volume footprint techniques to find demand zones with precision? I’m happy to share—just send me a message. No cost, no catch. I believe in helping people make smarter decisions.
Here are some of my recent analyses. Each one highlights key opportunities:
🚀 GMTUSDT: %35 FAST REJECTION FROM THE RED BOX
🎯 ZENUSDT.P: Patience & Profitability | %230 Reaction from the Sniper Entry
🐶 DOGEUSDT.P: Next Move
🎨 RENDERUSDT.P: Opportunity of the Month
💎 ETHUSDT.P: Where to Retrace
🟢 BNBUSDT.P: Potential Surge
📊 BTC Dominance: Reaction Zone
🌊 WAVESUSDT.P: Demand Zone Potential
🟣 UNIUSDT.P: Long-Term Trade
🔵 XRPUSDT.P: Entry Zones
🔗 LINKUSDT.P: Follow The River
📈 BTCUSDT.P: Two Key Demand Zones
🟩 POLUSDT: Bullish Momentum
🌟 PENDLEUSDT.P: Where Opportunity Meets Precision
🔥 BTCUSDT.P: Liquidation of Highly Leveraged Longs
🌊 SOLUSDT.P: SOL's Dip - Your Opportunity
🐸 1000PEPEUSDT.P: Prime Bounce Zone Unlocked
🚀 ETHUSDT.P: Set to Explode - Don't Miss This Game Changer
🤖 IQUSDT: Smart Plan
⚡️ PONDUSDT: A Trade Not Taken Is Better Than a Losing One
💼 STMXUSDT: 2 Buying Areas
🐢 TURBOUSDT: Buy Zones and Buyer Presence
🌍 ICPUSDT.P: Massive Upside Potential | Check the Trade Update For Seeing Results
🟠 IDEXUSDT: Spot Buy Area | %26 Profit if You Trade with MSB
📌 USUALUSDT: Buyers Are Active + %70 Profit in Total
🌟 FORTHUSDT: Sniper Entry +%26 Reaction
🐳 QKCUSDT: Sniper Entry +%57 Reaction
📊 BTC.D: Retest of Key Area Highly Likely
This list? It’s just a small piece of what I’ve been working on. There’s so much more. Go check my profile, see the results for yourself. My goal is simple: provide value and help you win. If you’ve got questions, I’ve got answers. Let’s get to work!

ARKUSDT CHART ANALYSİS - EDUCATİONAL POSTMachine Learning for Algorithmic Trading: Predictive models to extract signals from market and alternative data for systematic trading strategies with Python by Stefan Jansen (Packt Publishing)
Although the book's title might be a mouthful, which is fairly common for books on algorithmic trading (and crypto in general), Stefan Jansen's Machine Learning for Algorithmic Trading "introduces end-to-end machine learning for the trading workflow, from the idea and feature engineering to model optimization, strategy design, and Backtesting by using examples ranging from linear models and tree-based ensembles to deep-learning techniques from cutting edge research."
In the second edition, readers learn about working with various types of data (market, fundamental, alternative) in order to create tradeable signals. In addition, the book shows how readers can predict returns for both US and international assets, and even includes a handy appendix with 100+ alpha factor examples. If you're interested in getting into the nitty gritty of machine learning and algo trading, then this will be of interest to you.
One of the underlying principles of algo trading is trying to time the market using data and algorithms, and Jansen's book provides a wide range of useful techniques and models, ones which have something of value to learners of all levels with an interest in machine learning.

ARKUSDT SHORT !!!!!#ARK/USDT
Entry zone : 0.413751 - 0.4033068
Targets : 0.3996714 - 0.3915972 - 0.3835230 - 0.3754489 - 0.3673747 - 0.3593005 - 0.3512263 - 0.3431522
Stop loss :0.429819

TRADE PLAN FOR ARK FOR PROFITSHello guys, Another trade plan setup for ARK for profits , long term hold.
All setups are shown on the chart for easy understanding.
Tradehubng

ARKUSDT Trendline Betrayal Bearish Plunge !Trendline Break
The chart shows a clear upward trendline that has been broken. This break indicates a potential shift in market sentiment from bullish to bearish.
Retest Confirmation
After breaking the trendline, the price retraced upward, testing the previous trendline as resistance (red zone). This is a classic confirmation for a short setup.
Entry and Risk Zone
Entry :The short position is initiated just below the retest of the trendline, around the price of 0.5510.
Stop-Loss : Placed slightly above the retest zone, around 0.5897, to minimize risk if the price reclaims the trendline.
Target Zone
The blue area indicates the take-profit target, with a potential level around 0.3908. This level might have been chosen based on prior support or Fibonacci retracement levels.
Risk-to-Reward
The setup has a favorable risk-to-reward ratio, with the stop-loss relatively close to the entry and a much larger distance to the target.
Market Context
The sharp drop in price following the trendline break signals strong bearish momentum. Ensure that this move aligns with higher timeframes and broader market sentiment for confirmation.
Key Considerations
Watch for any sudden buying pressure or market reversal signs that could invalidate the setup.
Volume analysis can provide additional confirmation for the strength of the trendline break and the retest rejection.
Stay disciplined with stop-loss placement to manage risk effectively.
Book profits with usual profit locking rule of 10% by moving SL to BE for safe ride

ARKUSDT: Ready for the Next Big Move! (D1-W-M Analysis)🚀 ARKUSDT: Ready for the Next Big Move! (D1-W-M Analysis)
🌍 Market Overview:
ARKUSDT is showing impressive strength on D1-W-M timeframes. With strong growth potential, this is a chance to capitalize on the bullish trend and secure significant profits.
📊 Trade Plan:
📌 Entry Point:
Using RainBow MG3 Indicator: Follow BUY signals from RainBow MG3 on D1-W-M cycles for precise entry points.
Without the indicator: Accumulate around $0.54 – This is the optimal price range I recommend for entry.
🎯 Target:
100–150% profit – Anticipating the next strong wave of growth.
⏳ Hold Time:
4–5 weeks – Holding period aligns with the anticipated price movement cycle.
🔍 Why ARKUSDT?
D1-W-M Cycle Alignment: Strong alignment across multiple timeframes provides high confidence in this strategy.
High Momentum Setup: Technical indicators suggest a strong bullish move is imminent.
💡 Note:
I rely on the RainBow MG3 Indicator for identifying optimal entry and exit points. If you don't have access to this indicator, use the entry point range shared in this article as a guide.
🔥 Don't miss out on this opportunity! ARKUSDT is poised for a breakout – Take action today! 🔥

ARKUSDT - THIS IS ITTHIS IS WHAT YOU SHALL DO FOR ARKUSDT!!! Arkham at the perfect end on the point of precedence!

ARKUSDT: Is the Bullish Momentum on Thin Ice? Yello, Paradisers! #ARKUSDT is making waves again, but is it gearing up for a major breakout, or are we on the brink of a deeper correction? Let’s dive into the details to prepare for what’s next.
💎#ARK has shown a strong rebound from the support zone, signaling a potential continuation of its bullish movement. However, for ARK to confirm a bullish structure, it must break above the minor resistance at $0.671. If this breakout happens, ARK could rally toward the major resistance zone, marking a successful upward trajectory.
💎But what if ARK fails to break this resistance? Even if the price climbs to test the $0.671 level, a rejection could lead to a retest of the support area between $0.44 and $0.40. Historically, this zone has been respected multiple times, with the price consistently rebounding.
💎The critical risk emerges if ARK fails to rebound and breaks below the support area. A breakdown here would signal the loss of the higher low (HL) structure, likely turning the price bearish. In this scenario, ARK could continue its decline toward the major support zone at $0.30–$0.26. As long as ARK remains above this range, there’s still potential for a rebound.
💎However, if ARK’s daily candle closes below $0.26, the bullish case becomes invalidated. This would confirm a bearish trend, with the price likely to continue dipping further.
Stay focused and disciplined, Paradisers. Analyze the levels carefully, and always wait for confirmation. 🎖
MyCryptoParadise
iFeel the success🌴

SPOT ARK LONG 22.12.2024Fixation after containment of sales.
🎯Purpose:
0.7714
‼️Risk per trade: 0.5% of the allocated funds for spot trading.
Thank you for subscribing and responding🚀.

ARKUSDT: What Every Trader Needs to Know Right Now - Ark◳◱ On the BINANCE:ARKUSDT chart, the Trendline Touch pattern suggests momentum building up for a significant move. Traders might observe resistance around 0.7765 | 0.9164 | 1.1786 and support near 0.5143 | 0.392 | 0.1298. Entering trades at 0.5201 could be strategic, aiming for the next resistance level.
◰◲ General Information :
▣ Name: Ark
▣ Rank: 531
▣ Exchanges: Binance, Gateio, Mexc, Hitbtc
▣ Category / Sector: Infrastructure - Interoperability
▣ Overview: None
◰◲ Technical Metrics :
▣ Current Price: 0.5201 ₮
▣ 24H Volume: 3,361,359.843 ₮
▣ 24H Change: 1.9%
▣ Weekly Change: -17.63%%
▣ Monthly Change: -9.08%%
▣ Quarterly Change: 5.33%%
◲◰ Pivot Points :
▣ Resistance Level: 0.7765 | 0.9164 | 1.1786
▣ Support Level: 0.5143 | 0.392 | 0.1298
◱◳ Indicator Recommendations :
▣ Oscillators: BUY
▣ Moving Averages: SELL
◰◲ Summary of Technical Indicators : NEUTRAL
◲◰ Sharpe Ratios :
▣ Last 30 Days: -0.71
▣ Last 90 Days: 0.42
▣ Last Year: -0.05
▣ Last 3 Years: 0.27
◲◰ Volatility Analysis :
▣ Last 30 Days: 0.99
▣ Last 90 Days: 1.31
▣ Last Year: 1.19
▣ Last 3 Years: 1.19
◳◰ Market Sentiment :
▣ News Sentiment: N/A
▣ Twitter Sentiment: N/A
▣ Reddit Sentiment: N/A
▣ In-depth BINANCE:ARKUSDT analysis available at TradingView TA Page
▣ Your thoughts matter! What do you think of this analysis? Share your insights in the comments below. Your like, follow, and support are greatly valued and help sustain high-quality content.
◲ Disclaimer : Disclaimer
The content provided is for informational purposes only and does not constitute financial, investment, or trading advice. Always conduct your own research and consult a qualified professional before making any financial decisions. Use of the information is solely at your own risk.
▣ Explore the Power of Charting with TradingView
Unlock a wide range of financial analysis tools, data, and features to elevate your trading experience. Take a tour and see the possibilities. If you decide to upgrade your plan, you can receive up to $30 back. Discover more here - affiliate link -

SPOT ARK LONG 21.12.2024Fixation after exhaustion of sales.
🎯Purpose:
0.9132
‼️Risk per trade: 0.5% of the allocated funds for spot trading.
Thank you for subscribing and responding🚀.

I think no more clear than this oneThis pattern is called "negative divergence between price and volume".
When the price is moving upward (upper red line), but the volume is decreasing (lower red line), it signals weak buying momentum. This often suggests that the price rally may not be sustainable and could lead to a potential reversal or correction.

Building Support - Right under ResistanceI actually drew these S/R levels back at the beginning of the year when we had a little mini pump.
Here they are holding strong again, and we are building a nice base of action right below the first major leg of resistance.
There is a slight chance, we completely burst through the entire .65-1.00 range. Sometimes all the price action is priced out, in the face of a new market dynamic. This does NOT happen everytime. And in fact, and would be healthier to see a grinding move up through these resistance zone, where price breaks through, and retest it before making another move up.
Im not gonna be mad if we just rocket straight through to 1.00 and above. At that point, i'll take nearly any retest back in the 1.00-.65 zone. And reevaluate beyond that level.

ARK ANALYSIS (4H)From where we placed the red arrow on the chart, the ARK correction has started. An ABC appears to be completed.
Now the price has entered the bullish phase.
It looks like we are now entering a wave D or a bullish pattern.
The demand range is our rebuy range.
The targets are marked on the chart.
Closing a daily candle below the invalidation level will violate the analysis.
For risk management, please don't forget stop loss and capital management
When we reach the first target, save some profit and then change the stop to entry
Comment if you have any questions
Thank You

