ARPABTC trade ideas

ARPA.BTC (Y20.P3.E2).Pullback completed.**** continuation from the previous post, link below ***
Hi All,
The pullback to the 0.618 fib level was ideal and although I missed it, I'm looking to re-enter again.
Just need to time in the lower time frames.
This possibly can be a real good setup for a macro parabolic phase...time will tell.
OBSERVATIONS:
==============================
- 0.618 fib level retracement
- Stochastic RSI is lauched from the bottom level on the 12 HRLY, Daily is about too.
- Along with the phoeix indicator showing energy above the 50% and the Green RSI on the daily.
- Most important, the 12 hrly and daily candle sticks show bullish engulfing profile
- Confluence with the daily 21/34 ema as a bounce area.
THOUGHTS:
==============================
Too many points are positive, just be selective in your entrance for max effect.
As per the daily chart , it can go parabolic. for now, I have a short term target.
12 HRLY chart
Daily Chart
Regards,
S.Sari
PREVIOUS POST

please give me a cup of coffee!Remember to always, always place your stop loss at the appropriate levels immediately after you have put in your long/short position so as not to get stopped out at your trades.
>>>>> Always be prepared for either scenario of upwards movement, downwards movement, or sometimes even sideways movement (consolidation phase & sometimes even extended consolidation phases). <<<<<
Constructive and positive comments are welcome.
Consider leaving a like after viewing my post, and click on Follow to receive my latest and updated posts

ARPABTC - Long - Potential 43.27%ARPABTC - Long - Potential 43.27%
Entry - 342
TP1-373
TP2- 489
SL- 284
Please comment with thoughts and how you get on.
If you like the idea, then hit like on the idea & support with a follow.
Good luck out there!

ARPA BreakoutHey guys,
ARPA looking good and about to breakout this flag pattern.
I am looking for a safe play, best entry will be on the retest after the breakout.
Nice buy opportunity with good Risk/Reward.

ARPA/BTC: BINANCE (BUY ONLY AFTER CLOSING ABOVE 350)🛒 Pair: ARPA/BTC 🛒
⏰ 1399/06/02 ⏰
🕰 23/08/2020 🕰
📈 SCALP - SHORT - MID 📈
Ex: Binance
🛒 Buy 1 : 345 - 355 🛒 place Stop Buy
👉Sell Targets👈
🎯TP1: 375 🥉
🎯TP2: *** 🥈
🎯TP3: *** 🥇
🎯TP4: *** 🏆 BONUS
⛔️ SL : 295

ARPA/BTC (Bullish Early Sign?)ARPA/BTC
-ARPA Chain is on a short term downtrend from the High at 490 sat
-Its value has depreciated by over -40% at peak
-We can see a downward trendline resistance coming from the top
-This is a local barrier keeping the Bears in control
-During its downfall, we can see a 1st Bullish reaction at Key support area
-This zone is a confluence of Golden Fib, 200ma, and previous resistance zone
-My Bullish bias would be a retest of the recent low at 290 and trendline break up
-You may enter on support retest aggressively or wait for the breakout confirmation
-Either way, you must follow proper risk management and trading size
-Upside potential is up to 437 sat or higher

NO BULLSHIT 800% Dreams Achieve Small Targets with ( ARPA/BTC )NO BULLSHIT 800% Dreams Achieve Small Targets with ( ARPA/BTC ) and Leave
Buy in the BUY BOX ZONE
Targets Mentioned
LIKE And message me if you want to grow together with me!

ARPA broke resistance - does it survive the pullback?ARPA broke the resistance - let's see if it can survive the pullback and reach target 1 & 2


ARPABTC - Long - Potential 50.77%ARPABTC - Long - Potential 50.77%
Enter- 0325
TP1- 0395
TP2- 0490
SL- 0287
Happy Trading! Let us know how you get on Amigo's!

Looking Bullish ❕ There is a Strong Support Line On 360 Sat ,Buy Opportunity ,Looking Bullish
✅ Targets On The Chart
🔴 Stop loss zone : 350 ~ 345


ARPA.BTC (Y20.P3.E01).Good pullbackHi,
Here is a nice opportunity on the 4 HRLY timeframe.
Nice trend with 21 EMA etc and fib level
At least go 1 to 1,
Note slow filling orders, but liquity is there.
522 BTC in 24 hours
Cheers,
S.Sari


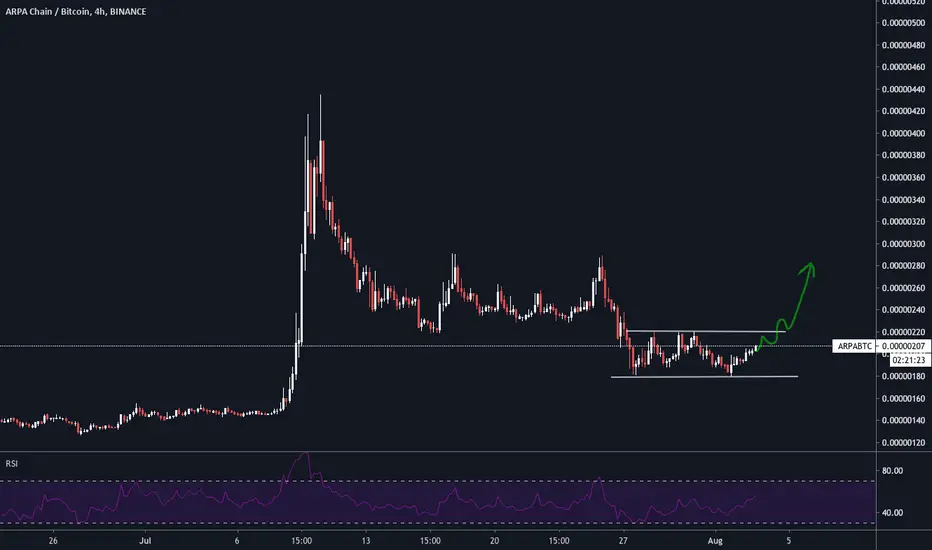
ARPA/BTC 4h (Binance) Falling wedge breakoutFA: Arpa Chain is about to release a new ecosystem initiative starting with liquidity mining and stakedrop! #DeFi
TA: Price is looking quite bullish after breaking-out that wedge and that would be a double bottom on LTF.
Current Price= 0.00000223
Buy Entry= 0.00000226 - 0.00000216
Take Profit= 0.00000261 | 0.00000305 | 0.00000377
Stop Loss= 0.00000150
Risk/Reward= 1:1 | 1:1.98 | 1:3.58
Expected Profit= +20.83% | +41.20% | +74.54%
Possible Loss= -20.83%
Fib. Retracement= 0.382 | 0.5 | 0.786 |
Margin Leverage= 1x
Estimated Gain-time= 480h


ARPA BTC Signal #ARPABTC (Short Term)
Buy: 0.00000208 - 0.00000198
Target 1: 0.00000214
Target 2: 0.00000223
Target 3: 0.00000239
Target 4: 0.00000270
Target 5: 0.00000312
Stoploss: 0.00000193
Invest: 3%
Risk/Reward: 5% / 54%