#ARPA CHAIN A Positive Move Entry : 0.00000147 - 0.00000136 - 0.00000128
Target 1 : 0.00000168
Target 2 : 0.00000190
Target 3 : 0.00000210
Target 4 : 0.00000258
Target 5 : 0.00000311
Stop loss : 0.00000112
Risk/Reward : 17%/120%
Do not hurry to buy, the price may go down to good places
Please share your opinion in the comments box and do not forget to press the like button
ARPABTC trade ideas

ARPA/BTC TA Update (Retest Bottom Trend-line?)ARPA/BTC
ARPA is forming a beautiful bullish descending channel on the 12-hour time-frame.
Though I'm not confident the 114 sats area will hold as the RSI is likely to enter the oversold territory again in the coming days.
The price could drop to the bottom trend-line at around 110 - 101 sats levels before we could see some potential buyers to step-in.
If ARPA hits my buy zone area, I'm expecting the price to consolidate in those regions for at least a week before it will try to push Higher.
It is a long process but that's how the market cycle goes.

ARPABTC 2HARPA about to do Breakout, there is H&S and probable of the Bat Pattern and CUP. Bullish is soon, Good luck!


Short term LONG position.I really love this kind of set up. Cyclical in nature and can depend on it most of the time.
However, end of the year and holidays make this a bit risky. It may play out as described but only possibly after the new year. Any other time....I'd be all over this .
Also....this is a very new coin and has yet to register much of a performance to gauge any realistic forecast.
My best advice for most of you ......avoid this trade for now. Too risky in my opinion.
I'm interested in what you think . Please leave a comment on your thoughts.
Regards.

ARPA/BTC TA Update (Bullish Pattern Confirmed)ARPA/BTC
ARPA broke bullish on this falling wedge pattern and setting up a Higher High. RSI is a bit extended on the overbought condition, the price might pullback to cool everything off before it continues another uptrend.

+30%gain vs -15% risk levelARPA moving with low volume.
If it breaks over 180-201sat range with volume, except a nice uptrend to 350-400sat
else, keep it long term

BITCOIN BTC/ARPA FAILING WEDGE We notice a Failing Wedge Pattern on ARPA - H4 Time Frame
The price is just testing the Resistance Line at the moment.
Breaking of this level and eventual retest may confirm us the reversal of the last bearish move.
That move has been accompanied of nice volume that is a bullish sign.

ARPA/BTC TA Update (Sideways Action?)ARPA/BTC
ARPA is still trapped inside this descending channel as the price keeps making lower highs. The next immediate support below is 120 sats and top resistance is 140 sats.
Until this pattern is broken, price action will just move sideways within a week. In the short term, Bears have control of this market situation.


ARPABTC look at whole sceneryWhen you look at Arpa after binance listing, you can see the correction around 135-140 which was the price before Binance listing. We can see a bit longer consolidation process at current level and slowly will go up with the mainnet news and trade event activity on binance in December.

ARPA Good suuport ARPA / BTC
Exchange : BINANCE
Buy : 150
Targets :
Tp 1 : 162 (8%)
Tp 2 : 174 (16%)
Tp 3 : 189 (26%)
Stop loss zone : 140 ~ 138

ARPA/BTC H4 breakout semms like Arpa founded bottom finally, after higher low and higher high, broken downtrend line , on H1 tf wecan see bullflag pattern wich is bullish continuation setup. volume rising, when price moving up wich is also bullish, worth to watch .

ARPABTCIF MACD WILL BE BULLISH WORTH TO TRY
YOU CAN REALIZE QUICK PROFIT STOP LOSS OS YOUR CHOICE ...

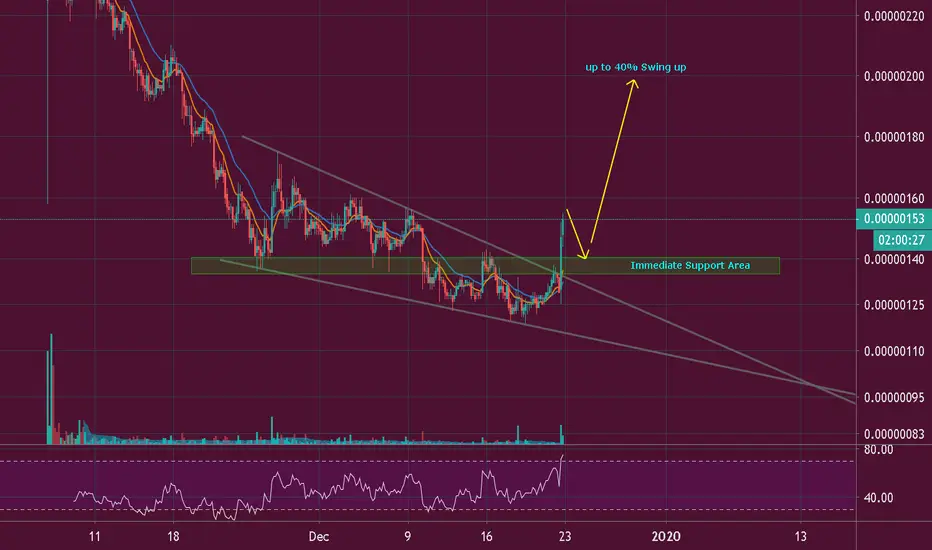
ARPA - Possible Break To The Upside of 30%+Arpa has dropped ever since its debut on Binance from 292 to its current level of 152. Here's a few bullish indicators which could see it jump over the next few weeks:
Looks like things could turn around from here. A strong support at 141 satoshi,
MACD crossover on the 4 hour,
Low RSI,
Good volume,
Good risk/reward ratio of 3.78 to 186 Satoshis,
Possible breakout of symmetrical triangle. for a measured move up to 192 Satoshis This would be void if it broke to the downside


Arpa,is the Downtrend done?Arpa is now in downtrend and try to breakout , and we are in the Bottom, we see high volume in last days , now we need to break 166( closing 4h candel above 166).
Buy zone: 144-150.
sell: 180 , 197. Good luck and be careful, dont forget Bitcoin ;).


$ARPA Vol 2Last time we had awesome profit. See
Enough consolidation for you. Let's pump it. But we need to break that big line first.

