ARUSDT trade ideas

ARUSDT will go around 56.89usdt !!!ARUSDT can go around 56.89usdt. If you go higher will hit 59.85 or 61.00usdt and support resistance it will be orange lane (56.89ust)!! If AR hit 59.85usdt and he go down (after hitting 59.85usdt) other support resistance is black/red lane (51.56usdt) and if AR can't stay on red-black support resistance (51.56usdt) he will go down to 45 or 48usdt!!!!

ARWEAVE UPDATEARUSDT multi timeframe update, expecting a bounce a new lower high to form from a daily perspective and possibly complete the harmonic pattern, as always we need to wait for correct entry confirmations before we can look for this intraday long to play the bounce.

AR-USDT Bullish Movements in the ChartAR-USDT Bullish Movements in the Chart
Entery Level and Take Profit is described in Chart.

ARas long as bitcoin plays somewhat nice id assume we would hit some of these targets. try to catch the retest of the purple line


AR / USDT LONG IDEAAR is forming an inverse head and shoulders. I entered AR with 5X leverage right now.

ARWEAVE UPDATE AR is looking beautiful here, we can see how the price made a liquidity dump below the uptrend support to hunt the stop losses of leveraged longs and likely induce bears into the market. Price then broke back above the zone confirming the move a fakeout and forming a large inverse head and shoulders formation. We can see a very clear level of supply which is the key level for bulls to break above in the near term. AR is a fundamentally SOLID project with huge potential in 2022 we are already holding on SPOT currently running in very small profit. Looking for more upside and a possible leveraged entry if we see a daily close above the supply zone.
Happy new year to you all. Wish you more health and wealth in 2022

ARUSDTArweave is in Solana Ecosystem and Coinbase Portfolio. I am pretty sure AR going to be 500$ on June 1.

ARUSDTPERP short setup SMC + retailThis is a mix of SMC (smart money concept) analysis and retail analysis
AR just broke down the rising wedge it was in, in the process of the breakdown, it created a LOT of liquidity in the form of imbalances and order blocks, looking for a retest entry at the order block above

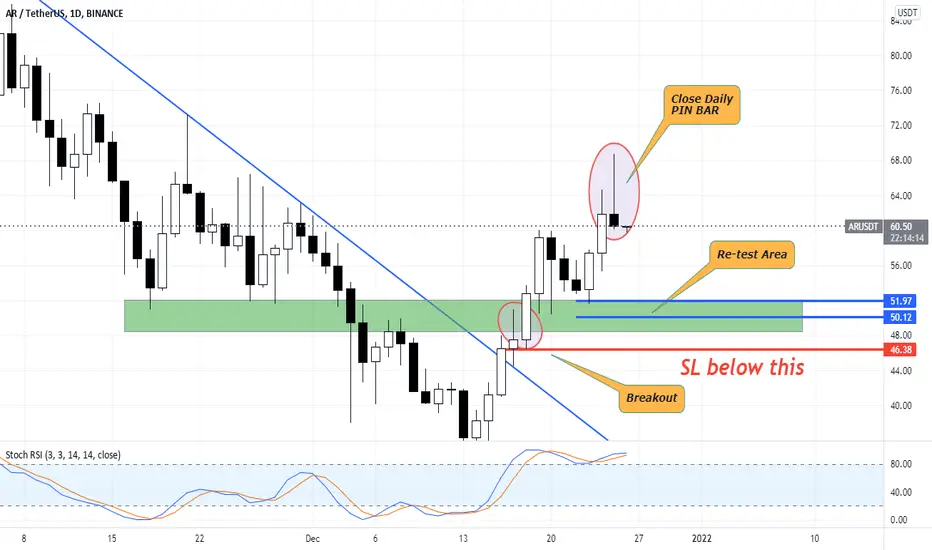
ARUSDT WITH BREAKOUT AND RETEST STRATEGYAR USDT
With trendline , AR clear breakout, wait the Retrace after the breakout
Key trading is patience
Good luck guys!
#indonesia #tipsfortradingplanning
ARUSDT Trend Broken & CwP Pattern | Expecting +65% MoveARUSDT Trend Broken & CwP Pattern | Expecting +65% Move
AR/USDT successfully broke the trend line that existed since November 5, 2021, and completed a strong bullish pattern called Cup and Handle.
Note:
1. Do your own analysis
2. Spot trading only
3. Do proper risk and money management
4. Respect your stop loss
5. I will not be responsible for any of your loss
6. Trade on your own Risk
7. Take the low risk that you can hold
Buying Zone: 59 - 61 - 62 - 63
TP1: 66.21
TP2: 73.46
TP3: 81.89
TP4: 91.05
New ATH: 101.55
SL: 51.42
Trade Risk: 14%
ROI: 64% - 67% - 70%


ARUSDT DailyPlotting Fibs Retracement Exercise
3 Confluences area of Fib Retracement
38.20% & 50%
50% & 61.80%
61.80% & 78.60%
Breakout from the falling wedges & the downward trend line.

AR has to test 36.5AR has completed the impulse wave at $91.
It's been happening the correction wave ABC which will be end at $31. Within wave A at $51 and wave B at $63. So wave C is done? NO.
Wave C has been done the 3rd wave at $38 and the final wave will be hit $31 and bounce back to $73.
Time will tell

AR update 1h 1220 1010AR update 1h 1220 1010 AR update 1h 1220 1010AR update 1h 1220 1010AR update 1h 1220 1010AR update 1h 1220 1010AR update 1h 1220 1010AR update 1h 1220 1010AR update 1h 1220 1010AR update 1h 1220 1010AR update 1h 1220 1010AR update 1h 1220 1010


AR, reversal pattern.The following content is machine translation:
The storage leader has performed very well in the storage sector.
The current V reversal pattern.
Break the downtrend line.
The macd indicator is about to be a golden cross, see more.
Do more short-term operations.

Possible bottom for ARAR came to support zone, break downtrend line and RSI is in neutral zone. We need to wait for re-test from above and uptrend. SL is small, possible take is delicious.


ARTHERUS DOLLAR short in the specified area.Price action trading. There is always a risk of capital loss for any investment. The investor shall make the final decision after studying and researching each provided analysis extensively and shall take responsibility for any consequences
