ASTUSD trade ideas
AIRSWAP Stock Chart Fibonacci Analysis 021325Trading Idea
1) Find a FIBO slingshot
2) Check FIBO 61.80% level
3) Entry Point > 0.07/61.80%
Chart time frame: B
A) 15 min(1W-3M)
B) 1 hr(3M-6M)
C) 4 hr(6M-1year)
D) 1 day(1-3years)
Stock progress: A
A) Keep rising over 61.80% resistance
B) 61.80% resistance
C) 61.80% support
D) Hit the bottom
E) Hit the top
Stocks rise as they rise from support and fall from resistance. Our goal is to find a low support point and enter. It can be referred to as buying at the pullback point. The pullback point can be found with a Fibonacci extension of 61.80%. This is a step to find entry level. 1) Find a triangle (Fibonacci Speed Fan Line) that connects the high (resistance) and low (support) points of the stock in progress, where it is continuously expressed as a Slingshot, 2) and create a Fibonacci extension level for the first rising wave from the start point of slingshot pattern.
When the current price goes over 61.80% level , that can be a good entry point, especially if the SMA 100 and 200 curves are gathered together at 61.80%, it is a very good entry point.
As a great help, tradingview provides these Fibonacci speed fan lines and extension levels with ease. So if you use the Fibonacci fan line, the extension level, and the SMA 100/200 curve well, you can find an entry point for the stock market. At least you have to enter at this low point to avoid trading failure, and if you are skilled at entering this low point, with fibonacci6180 technique, your reading skill to chart will be greatly improved.
If you want to do day trading, please set the time frame to 5 minutes or 15 minutes, and you will see many of the low point of rising stocks.
If want to prefer long term range trading, you can set the time frame to 1 hr or 1 day.

ASTUSD Stock Chart Fibonacci Analysis 021225Trading Idea
1) Find a FIBO slingshot
2) Check FIBO 61.80% level
3) Entry Point > 0.76/61.80%
Chart time frame: B
A) 15 min(1W-3M)
B) 1 hr(3M-6M)
C) 4 hr(6M-1year)
D) 1 day(1-3years)
Stock progress: A
A) Keep rising over 61.80% resistance
B) 61.80% resistance
C) 61.80% support
D) Hit the bottom
E) Hit the top
Stocks rise as they rise from support and fall from resistance. Our goal is to find a low support point and enter. It can be referred to as buying at the pullback point. The pullback point can be found with a Fibonacci extension of 61.80%. This is a step to find entry level. 1) Find a triangle (Fibonacci Speed Fan Line) that connects the high (resistance) and low (support) points of the stock in progress, where it is continuously expressed as a Slingshot, 2) and create a Fibonacci extension level for the first rising wave from the start point of slingshot pattern.
When the current price goes over 61.80% level , that can be a good entry point, especially if the SMA 100 and 200 curves are gathered together at 61.80%, it is a very good entry point.
As a great help, tradingview provides these Fibonacci speed fan lines and extension levels with ease. So if you use the Fibonacci fan line, the extension level, and the SMA 100/200 curve well, you can find an entry point for the stock market. At least you have to enter at this low point to avoid trading failure, and if you are skilled at entering this low point, with fibonacci6180 technique, your reading skill to chart will be greatly improved.
If you want to do day trading, please set the time frame to 5 minutes or 15 minutes, and you will see many of the low point of rising stocks.
If want to prefer long term range trading, you can set the time frame to 1 hr or 1 day.

AstusdHad tested upper support recently and got rejected, daily macD bullish and will like retest 0.22 resistance nex if it breaks there is weaker middle resistance follow by another heavy resistance in bold red color. This is a lowcap project on coinbase.
not FA.

ASTUSDT ASTBTCHello my friends
This is a good opportunity to profit in a bull market
Buy and hold it
Don't need SL but you have to be patient


road map for ast usdt next month ast usdt in bearish trend i expect the start of the bullish trend in this area good luck for all traders

BEYOND THE CHARTWe can see on the EMA Ribbon that the previous attempt to change the trend was unsuccessful.
Latest attempt has been successful and we will see a continuation shortly.
It is worth noting for those who are unaware; This coinbase price chart is missing the price mark down phase and accumulation phase.
Referring to this chart only will make it difficult to find the best possible target.
The BTC / AST pairing is also driving the volatility as more capital (when compared to fiat) rapidly enters and leaves.
I am basing my analysis and targets on the information above.

AST - ASCENDENT TRANGLEWe are facing AST making a ASCENDENT TRIANGLE that is a bullish's pattern (timeframe D1). In the next hours we probably will broke the border of the triangle to UP and continue the moviment until the higher Bollinger Band.

Interesting Fib Circle PeaksOn this chart it can be seen that Fib circles correspond to opposite peaks within the current uptrend (red ovals)
I'm not sure of the correlation and causation of this, but it is pretty cool to see
Price will likely continue up through the channel placed


AST/USD - UPDATE - HANGING MANHi guys,
Just to share an update about my previous analysis. Things are doing well for us, but I have a concern about the last 1d candle, looks like a pattern that would bring our price down, hanging man pattern, let's wait for next for the confirmation. If the next candle is red there is our confirmation.
Enjoy the profits,
See you soon.
Please give a like in the page and follow me for more.

AST/USDSo guys, I already took I good profit in AST, 170% amazing.
I'm just thinking that maybe the chart is starting to form a bullish again in case of this happen, there is a huge chance that the price breaks the major resistance chasing bigger prices. (Something like 0.82) Fibonacci confirms that.
Please if you like give a like and follow me for more.
Comments also welcome.
Thanks


AST What will she doIt follows the Trend Line. When rising, it may form a Cup.
This is just the tutorial chart for me. Absolutely Not Investment Advice!


AST Consolidating Post-BreakoutAST has been on an uptrend since December and broke out of its channel last week before retesting the upper trend line.
If successful, expecting this to go on a faster uptrend, with some good gains.

Air my swapAST.
All is bullish. 9 february news coming with Consensys.
=> twitter.com/airswap/status/1355223372104396804
DEFI
DEX
20 Millions cap...


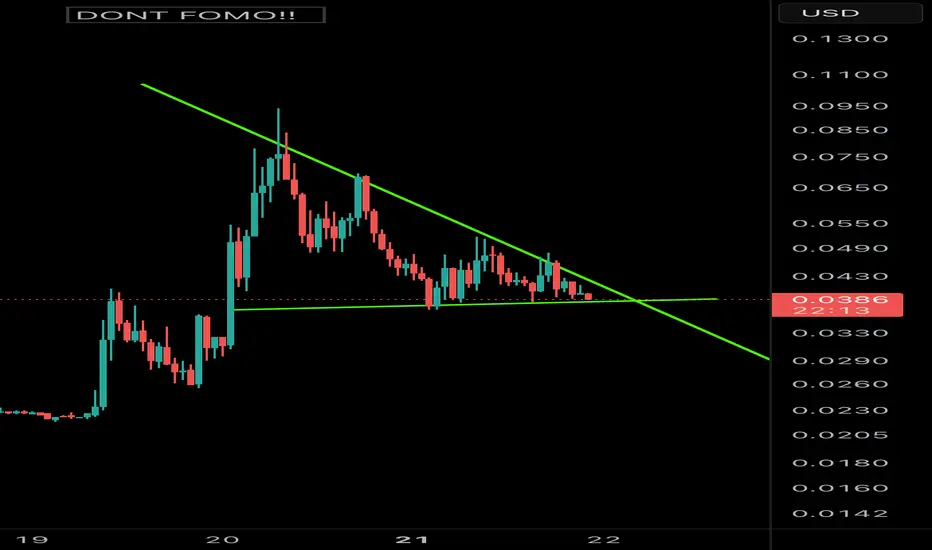
AirSwap ASTUSD - A breakoutPossible bullflag forming above the 200MA.
Large falling wedge has led to this breakout.
