ADH After huge bearish scenario, finally it completed wxy elliot wave. I set the target according to those of the previous highs. The market sentiment seems bullish setting another HH from third leg of Y.
I hope it goes up according to my plans.
*not a trading tips. count might be wrong.
ADH trade ideas

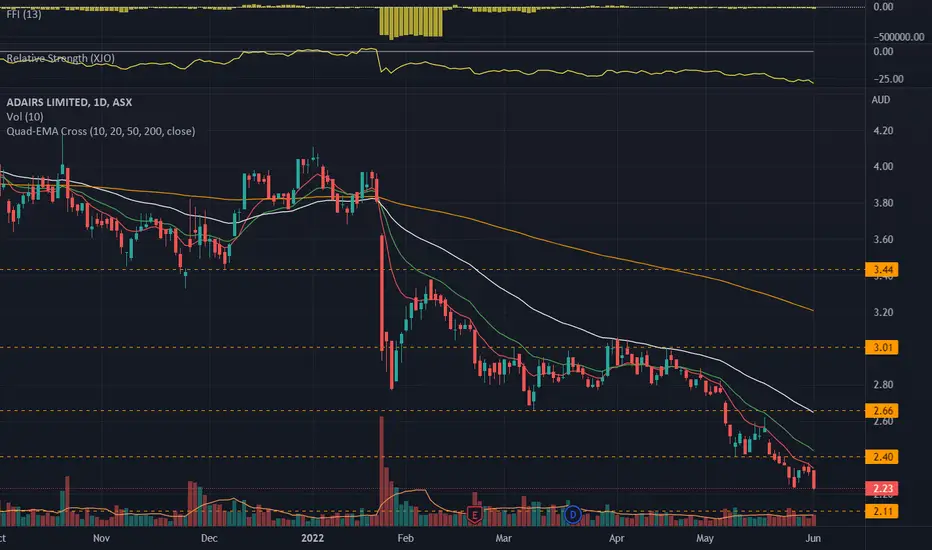
ADH.ASX_Bearish Pullback Trade_ShortENTRY: 2.24
SL: 2.42
TP: 2.09-2.11
- ADX>25
- Daily RS -ve
- Daily FFI -ve
- Weekly RS -ve
- Weekly FFI -ve
- Moving averages are aligned.
- Breakdown on 20 May 2022 with a pullback to support-turn-resistance area (2.40) before moving down again.
- Entry based on today >3% rebound off 10EMA with volume.
adairs ADH longhits the gap fill at $3.64 for 12%, if strong support goes to trend line $3.95 for 22% approx 4 week time frame

ADH longadairs should have a nice bounce over the next 4 weeks up to 3.80 giving 20% gain if breaks that trend line should reach 4.20

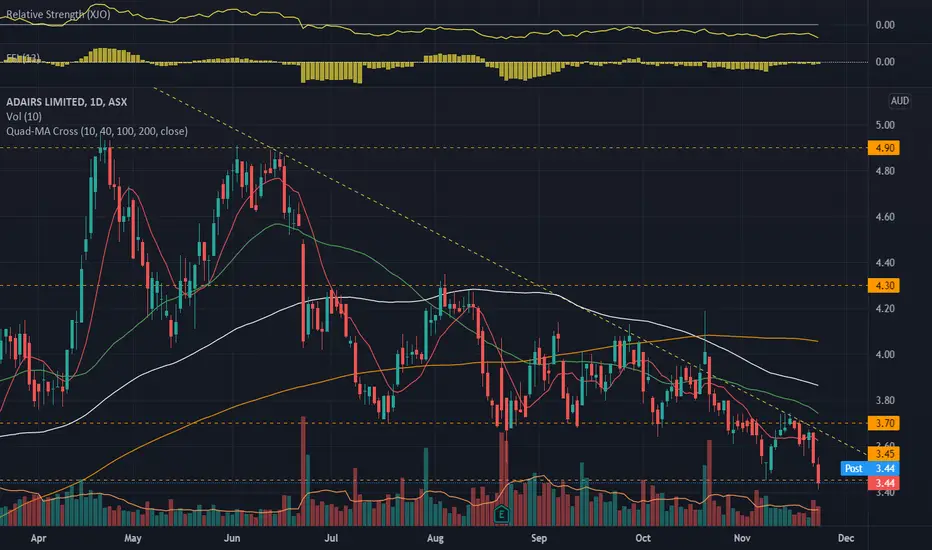
ADH.ASX_Breakdown Trade_ShortENTRY: 3.45
SL: 3.80
TP: 3.04-3.12
- ADX<20. Would like to be higher.
- RSI<50,RSI>30
- Daily RS -ve
- Daily FFI -ve
- Daily MACD -ve
- Weekly RS +ve
- Weekly FFI -ve
- Weekly MACD -ve
- Range since 23 Jun 2021 shows sellers in control.
- Broke down from triple top formation since Aug 2021 and retraced under lower volume before resuming downtrend.
- Break previous low today with above average volume.
Potential Long Setup for ADH - Daily ChartADH has presented a good trade setup, price has recently broken out of a key level and has now come back to retest this level, broken resistance commonly acts as support, which makes it a textbook trade setup to the long side. if we get a strong close today, that would be a buy signal for me with a stop loss 1 ATR below recent lows, plenty of upside potential as ADH is in a long term uptrend.

$ADH.asx- Price is breaking out of pennant pattern$ADH.asx- Price is breaking out of pennant pattern, looks good to test old highs...
Took a position yesterday, Let's see...GL!
Please ALWAYS DYOR First!

ADH bouncing from support around $3.10 Strong level of support around $3.10 .. looks like it has yet again bounced from this level and may tested upper range. Looks to be value at the moment.

ADH:ASX - ADAIRS LIMITED - Through resistanceAdairs has been another price beast similar to ASX:KGN and ASX:TPW post the Covid March lows. Had a bit of a pullback and looks to be continuing now past resistance. Could be worth a look.

ADH.ASX Interesting discovery, possible to make 8% if TA works4/6/2020
My buy price is set @ 1.83
If able to buy, sell @ 2.10

Potential Play on ADH from $2.05 to $2.13Identified a symmetry pattern present on the daily charts and supported on the hourly charts too. On the daily charts there was a symmetry of 14 bars, with varying % gains. These symmetry positions are taken from an upward analysis, given the stock appears to be trending down (based on shorter time frames).
The hourly chart also supports the entries, however, due to the smaller time frames, there are multiple clusters, but the entry position of $2.05 (zone) to $2.13 (zone) is supported.
From a 15 minute to a 5 minute chart pattern there is no support of this theory.

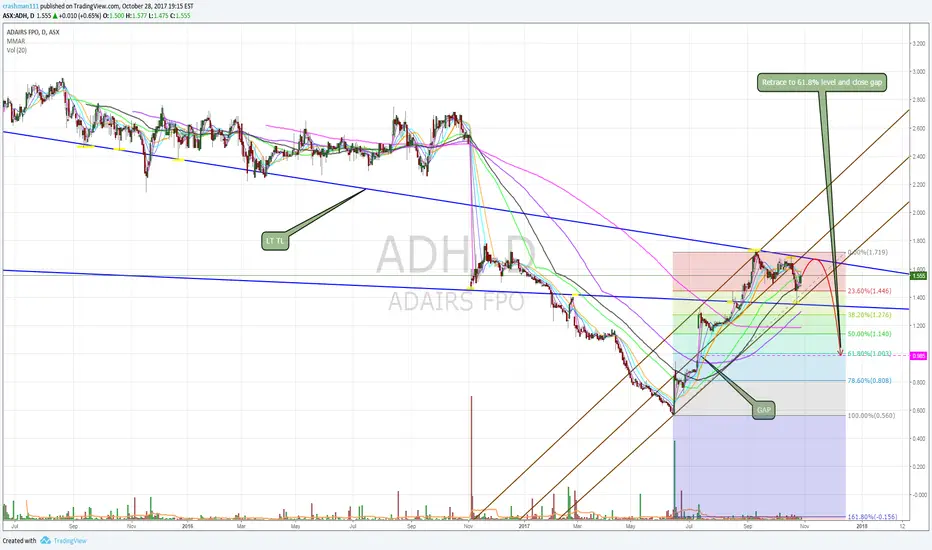
$ADH Fall after small rally to resistance line.
A low vol gap still needs to be dealt with and in line with a 61.8% retracement after recent rally.
20MA approaching 50MA