$APX - APPEN - Breaking through resistance to new highs$APX - APPEN - Breaking through resistance to new highs
Appens looking good at the moment. Bit of volume coming through should keep it going. I'm currently up around 20% so far from first purchase. Might look to top up if it looks to continue with a bit of pressure taken off the RSI / retrace and rebuild.
Appen Limited is engaged in the provision of data solutions and services for global technology companies and government agencies. The Company operates through two segments: Content Relevance and Language Resources. The Content Relevance segment provides annotated data used in search technology (embedded in Web, e-commerce and social engagement) for managing relevance and accuracy of search results. The Language Resources segment provides data used in speech recognizers, machine translation, speech synthesizers and other machine-learning technologies for devices, including Internet-connected devices, in-car automotive systems and speech-enabled consumer electronics. Its solutions include search technology, such as whole-page evaluation and query categorization; language technology, such as phonetic transcription, sentiment analysis, speech-recognition training data, and conversational data; social technology; crowd sourcing, and project management for global deployments.
APX trade ideas

Appen Ready to Bounce Long Appen is a global leader in the development of high-quality, human annotated datasets for machine learning and artificial intelligence. Founded in 1990 it has developed into a market leader position in an increasingly automated and data rich world. Customers of Appen have now realise the value of data and the possibilities that can be unlocked through understanding data to leverage value through Artificial intelligence. In doing so companies can automate there businesses and services, whilst also achieving productivity gains.
We expect the Appen price to bounce from an identified support of 10.55, as we recognize Appen shares have consistently bounced from previous support levels in its history. Recent market volatility has placed downward pressures on the stock and created a buy opportunity in our opinion.
Even in worsing market conditions we think that customers of appen will continue demand its services, in light of the imperative to develop AI competitive edges and productivity gains.

Appen Prediction (ASX:APX)Good morning all,
Here is my personal opinion on the future of the heavily publicised, machine learning company, Appen.
By looking at the trend line across a history of lows it shows that the position we are currently in is quite a major moment.
In my opinion 1 of the 2 options below will occur:
Option 1: Price bounces back, bottoming at around $11.15 before rising back up on another wave
Option 2: Price continues downfall, breaks trend line and retests supports at the $10 mark
Disclaimer: Please take all of my ideas with a grain of salt as these are mostly for me to look back and reflect so I can learn and grow as a trader :)
Wishing a good day to you all,
Kyle


APX Target $15, 2000% return in 3 years2018.06.18 TA Report
Aussie Market Buy/Sell ratio = 0.44
Buys: 269 (13.1%)
Sells: 613 (29.7%)
Hold: 1179 (57.2%)
Let's see some history relative timing values by VectorVest on this stock:
18-Jun = 1.70
15-Jun = 1.76
14-Jun = 1.73
13-Jun = 1.70
12-Jun = 1.65
APX.AX has a current Value of $3.58 per share, which is overvalued compared to its Price of $12.78 per share. Value is computed from forecasted earnings per share, forecasted earnings growth, profitability, interest, and inflation rates.
RT analyzes a stock's price trend. APX.AX has a Relative Timing of 1.70, which is excellent on a scale of 0.00 to 2.00. RT is computed from an analysis of the direction, magnitude, and dynamics of a stock's price movements day-over-day, week-over-week, quarter-over-quarter and year-over-year. If a trend dissipates, RT will gravitate toward 1.00.
CI is an indicator which reflects a stock's ability to resist severe and/or lengthy price declines. APX.AX has a CI of 1.93, which is excellent on a scale of 0.00 to 2.00. CI is based solely upon a stock's long-term price history.
As RT keeps rising in the last few days but it U-turn from 1.76 to 1.70 sharply. This is an alert.
Let’s have a look on the technical analysis:
Triangle Breakout
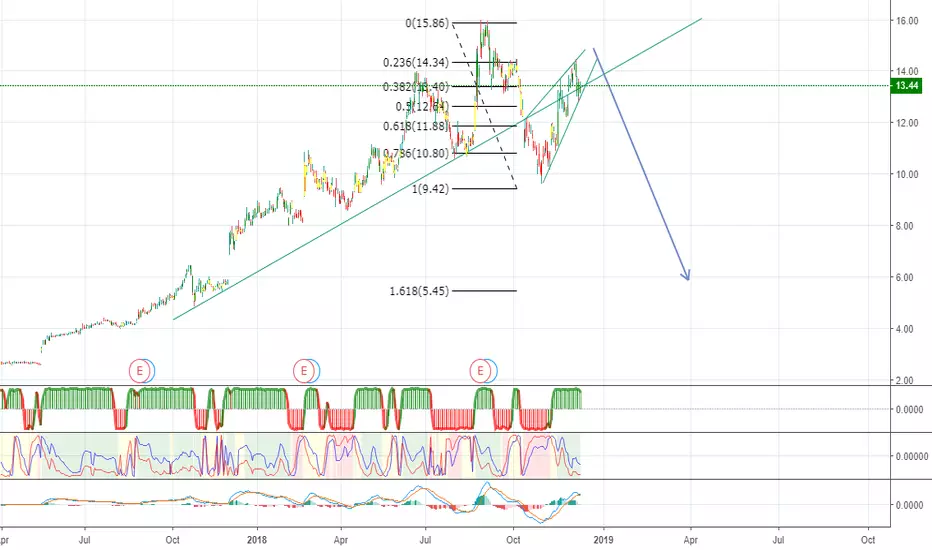
After the recent triangle breakout, APX soared 20% in a week. The current price is sitting on Fib channel 78.6%. We see a potential bearish harami. We will confirm if there is a bearish candlestick after today’s market.
Ichimoku Analysis
The chikou span shows a bit of turning signal. We may consider a technical adjustment back to Fib Ret 38.2% ($11.28) which is also close to Kijun-sen’s value $11.265.
In a longer run, APX’s target is about $15 - $16.

APPEN is ready to soarToday's Aussie Market Buy/Sell ratio = 0.24
Buys: 141
Sells: 594
Hold: 1298
Let's see some history relative timing (RT) values by VectorVest on this stock:
17-Apr = 1.26
16-Apr = 1.13
13-Apr = 1.04
12-Apr = 0.99
11-Apr = 0.96
APX.AX has a current Value of $3.46 per share, which is OVERVALUED compared to its Price of $9.27 per share. Value is computed from forecasted earnings per share, forecasted earnings growth, profitability, interest, and inflation rates.
RT analyzes a stock's price trend. APX.AX has a Relative Timing of 1.13, which is good on a scale of 0.00 to 2.00. RT is computed from an analysis of the direction, magnitude, and dynamics of a stock's price movements day-over-day, week-over-week, quarter-over-quarter and year-over-year. If a trend dissipates, RT will gravitate toward 1.00.
As RT keeps rising in the last few days, it is a good sign.
When you have a midas touch graph ready, you will see that the MA RT (40) is declining. That means it is not good to hold for a longer term.
Let’s have a look on the technical analysis:
A "Continuation Wedge (Bullish)" chart pattern formed on Appen Ltd.
After a temporary interruption, the prior uptrend is set to continue. A Continuation Wedge (Bullish) represents a temporary interruption to an uptrend, taking the shape of two converging trendlines both slanted downward against the trend. During this time the bears attempt to win over the bulls, but in the end the bulls triumph as the break above the upper trendline signals a continuation of the prior uptrend.
Not only we have the falling wedge chart pattern breakout today, we also find MACD crossover UP and the 8 & 20 EMA most likely crossover too, which are the good sign for LONG position.
The target can be measure by copying the price range between point 1 and point1’ to point 4’. Therefore $10.91 will be the short term goal.
Support & Resistance:
Ichimoku tells us that there is a minor resistance at where the top of green cloud. i.e. $9.82 and a major support at $9.45. Please also be aware that the tip of the chinkou-span also be a resistance. i.e. $10.6.

$APX breakaway Gap up on positive earnings resultStock has a tendency to gap higher and run off positive earnings , i expect this to go higher from here.
