FBU Fletcher Building NZLooking at Macro timeframe and there are some interesting levels coming up
Large scale harmonic bat pattern and demand level,
Coupled with lower timeframe fibonacci cluster levels just above and around the higher timeframe demand level
Fundamentally this stock is ~50% undervalued, losing money bu
Next report date
—
Report period
—
EPS estimate
—
Revenue estimate
—
−0.25 AUD
−207.39 M AUD
7.02 B AUD
1.04 B
About FLETCHER BUILDING NPV
Sector
Industry
CEO
Andrew Martin Richard Reding
Website
Headquarters
Auckland
Founded
1909
ISIN
NZFBUE0001S0
FIGI
BBG000GVQH43
Fletcher Building Ltd. engages in the manufacture and distribution of building materials. It operates through the following segments: Building Products, Distribution, Concrete, Australia, Residential and Development, Construction, and Corporate and Other. The Building Products segment supplies building products used both commercially and in residential markets. The Distribution segment includes building and plumbing distribution businesses. The Concrete segment is involved in the concrete value chain, including extraction of aggregates, and the production of cement and concrete. The Australia segment focuses on the manufacture and distribution of building materials across Australia. The Residential and Development segment refers to the building and sale of residential homes, and apartments. The Construction segment supplies building and maintenance services for infrastructure projects. The Corporate and Other segments relate to other building materials activities. The company was founded in 1909 and is headquartered in Auckland, New Zealand.
Related stocks

FBU Weekly Closer view of ButterflyAppears to have expanding triangle in the CD leg of a larger butterfly pattern
Hoping it drops to around $1.80 and will buy around there with any buying pressure showing

FBU Monthly Fletcher Building On trading halt while they do a $700mil capital raise
Hoping it drops to ~$1.80 ish for a long term buy due to technicals but fundamentally needs a restructure of debt or more equity...
Carrying too much debt from memory due to their residential developments with long cash cycle payments which is

FBU Fletcher Building Monthly Near buying levels...FBU Fletcher building near buying levels
Currently getting near demand level, currently has forward dividend of 11% but earnings have shrunk dramatically to loss making and likely going to restructure business or resize operations
No action as yet as there is no clear signal right now to buy, but

FBU - Relative Return for the first 7 trading days of SeptemberIn relative terms, the first 7 trading days of September have been reasonably positive for Fletcher Building Limited (ASX:FBU).
Since 2000, the first 7 trading days of September provided an average relative return vs All Ordinaries Index (ASX:XAO) of 3.14%, with a relative win rate of 17 from 21, &

FBU Long after breaking out with high volumeEntry: 6.77
Stop loss: 6.53
Went long in the counter after it broke out with high volume.
Would have preferred a better close though.

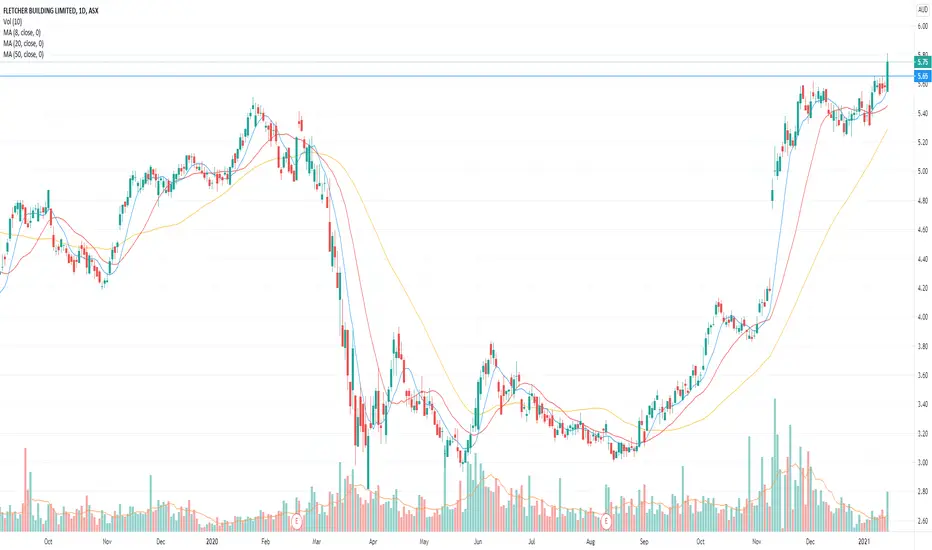
FBU long after breakout with high volumeEntry: 5.76
Stop loss: 5.55
Broke out of its recent high with very high volume today.
A cup and handle breakout supported by the orderly SMAs.
FBU.ASX_LongENTRY: 5.76
TP1: 6.06
TP2: 6.60
SL: 5.52
- ADX>25
- RSI>60
- FFI and RS +ve
- MA are aligned
- Breakout on 15 Jan 2021 with good volume
- Retraced today on lower volume

Fletcher BuildingWatch List Excercise - Looks like it could be on the move again, Set an alert a few cents above the current high and for the candle to close above the current high, prior to Covid crash.
Fundamentals are rubbish, net profit margin -2.52%, but has made money can make money, Future must be looking
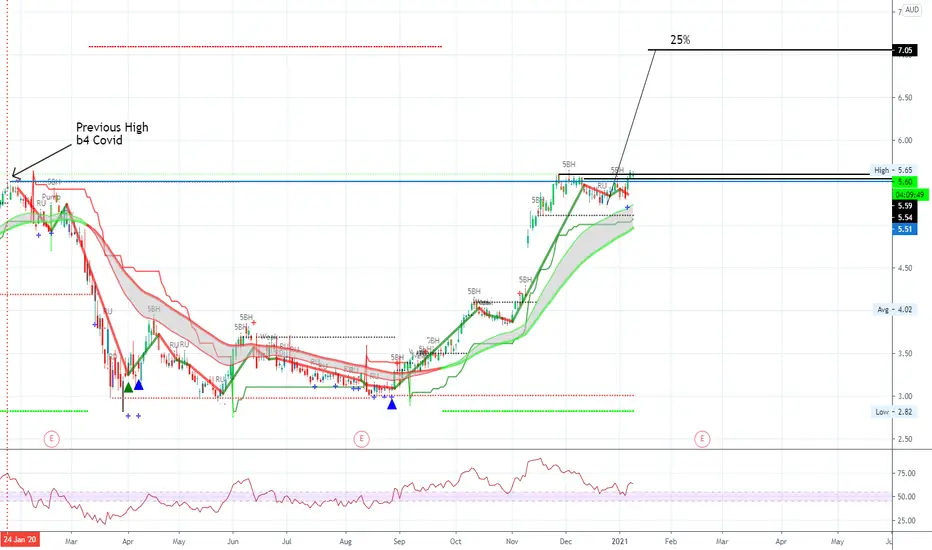
Fletcher Building Shorter term view of Fletchers
Potentially 21% return on ya Bucks by February
Looking very Bullish
Fundamentals are Rubbish but who cares this is the Share market things don't have to make sense, just get on the Trend.
Just look at Meridian Energy MEL has shot up 128% since July 9th 6 mths even

See all ideas
Summarizing what the indicators are suggesting.
Neutral
SellBuy
Strong sellStrong buy
Strong sellSellNeutralBuyStrong buy
Neutral
SellBuy
Strong sellStrong buy
Strong sellSellNeutralBuyStrong buy
Neutral
SellBuy
Strong sellStrong buy
Strong sellSellNeutralBuyStrong buy
An aggregate view of professional's ratings.
Neutral
SellBuy
Strong sellStrong buy
Strong sellSellNeutralBuyStrong buy
Neutral
SellBuy
Strong sellStrong buy
Strong sellSellNeutralBuyStrong buy
Neutral
SellBuy
Strong sellStrong buy
Strong sellSellNeutralBuyStrong buy
Displays a symbol's price movements over previous years to identify recurring trends.
Frequently Asked Questions
The current price of FBU is 2.79 AUD — it has increased by 2.95% in the past 24 hours. Watch FLETCHER BUILDING LIMITED stock price performance more closely on the chart.
Depending on the exchange, the stock ticker may vary. For instance, on ASX exchange FLETCHER BUILDING LIMITED stocks are traded under the ticker FBU.
FBU stock hasn't changed in a week, the month change is a −6.69% fall, over the last year FLETCHER BUILDING LIMITED has showed a 0.65% increase.
We've gathered analysts' opinions on FLETCHER BUILDING LIMITED future price: according to them, FBU price has a max estimate of 3.84 AUD and a min estimate of 1.65 AUD. Watch FBU chart and read a more detailed FLETCHER BUILDING LIMITED stock forecast: see what analysts think of FLETCHER BUILDING LIMITED and suggest that you do with its stocks.
FBU stock is 4.41% volatile and has beta coefficient of 1.36. Track FLETCHER BUILDING LIMITED stock price on the chart and check out the list of the most volatile stocks — is FLETCHER BUILDING LIMITED there?
Today FLETCHER BUILDING LIMITED has the market capitalization of 2.99 B, it has decreased by −2.81% over the last week.
Yes, you can track FLETCHER BUILDING LIMITED financials in yearly and quarterly reports right on TradingView.
FLETCHER BUILDING LIMITED is going to release the next earnings report on Aug 19, 2025. Keep track of upcoming events with our Earnings Calendar.
FBU earnings for the last half-year are 0.05 AUD per share, whereas the estimation was 0.05 AUD, resulting in a 1.86% surprise. The estimated earnings for the next half-year are 0.13 AUD per share. See more details about FLETCHER BUILDING LIMITED earnings.
FLETCHER BUILDING LIMITED revenue for the last half-year amounts to 3.42 B AUD, despite the estimated figure of 3.10 B AUD. In the next half-year revenue is expected to reach 3.53 B AUD.
FBU net income for the last half-year is −121.15 M AUD, while the previous report showed −97.75 M AUD of net income which accounts for −23.93% change. Track more FLETCHER BUILDING LIMITED financial stats to get the full picture.
As of Jul 19, 2025, the company has 18 K employees. See our rating of the largest employees — is FLETCHER BUILDING LIMITED on this list?
EBITDA measures a company's operating performance, its growth signifies an improvement in the efficiency of a company. FLETCHER BUILDING LIMITED EBITDA is 689.84 M AUD, and current EBITDA margin is 10.86%. See more stats in FLETCHER BUILDING LIMITED financial statements.
Like other stocks, FBU shares are traded on stock exchanges, e.g. Nasdaq, Nyse, Euronext, and the easiest way to buy them is through an online stock broker. To do this, you need to open an account and follow a broker's procedures, then start trading. You can trade FLETCHER BUILDING LIMITED stock right from TradingView charts — choose your broker and connect to your account.
Investing in stocks requires a comprehensive research: you should carefully study all the available data, e.g. company's financials, related news, and its technical analysis. So FLETCHER BUILDING LIMITED technincal analysis shows the neutral today, and its 1 week rating is strong sell. Since market conditions are prone to changes, it's worth looking a bit further into the future — according to the 1 month rating FLETCHER BUILDING LIMITED stock shows the sell signal. See more of FLETCHER BUILDING LIMITED technicals for a more comprehensive analysis.
If you're still not sure, try looking for inspiration in our curated watchlists.
If you're still not sure, try looking for inspiration in our curated watchlists.