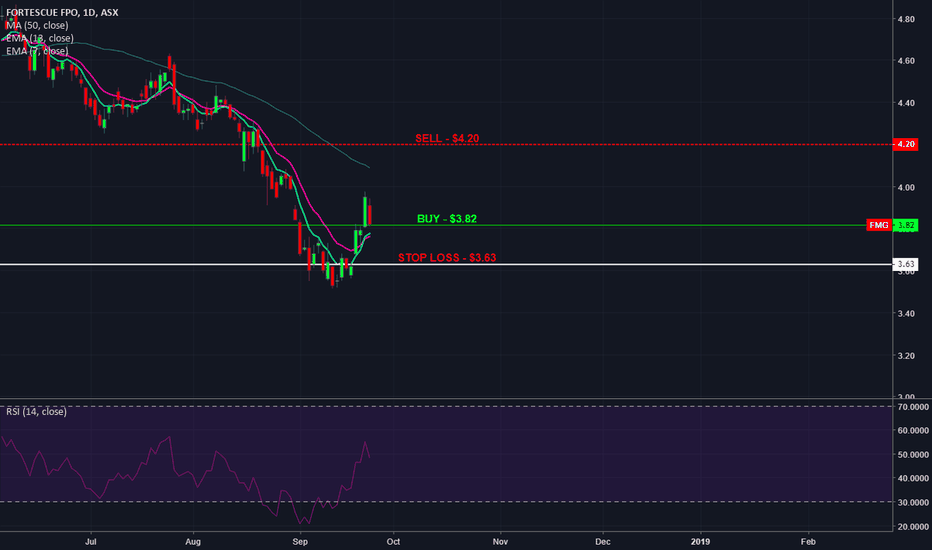
FMG trade ideas
FMG - Short - Fear overtakes Rational thinkingFMG has exploded in price this week off the back of some terrible news coming from the Vale Disaster where a tailings dam has given way killing 100s. The market has reacted to this news on fear that global supplies of iron will be threatened. Surely there will be disruptions to the iron supplies in the short term however the market has overreacted. A tailings dam will often be associated with one mine deposit and it is know that Vale operates multiple mines with an extensive supply network. It is likely the affected mine will be closed, whilst the rest remain operational.
From the chart, we see several indicators dropping off, namely the RSI, Volumes and MACD. Support level will be hard to judge but could sit at $5 in the next few months.
Furthermore, there are signs of improving market sentiment on the back of interest rates remaining low and good signs of earnings from US companies, this could in the short term support prices.
en.wikipedia.org(company)#/media/File:FCA_e_Vit%C3%B3ria_a_Minas_railroads.jpg
FMG LongLong way to the top. However, the recent breakout higher bodes well for FMG historically. Plus, in terms of big Aussie miners it has been lagging behind for quite a while. Geo-political events could make the setup on this chart fail, or just take longer to achieve, but FMG is solidly in an uptrend at the moment (daily, weekly, hourly) which will hopefully continue when their new dividend is announced etc.
Alternate 2 Long term view of FMGCould be a complex correction of WXY's that make up the major waves ABC.
So we have completed major wave A and B. Now we are in the process of completing wave X which makes major wave C.
If I'm right we have already completed wave W and now on wave X of Major wave C.
This will take us to roughly $5.80 before we come crashing down to below $2 for the completion of C.
From there we can commence the impulse bull run that will eventually take us to about $18....But this is years away.
FMG path to $5.30FMG is commencing a X wave which should take more than a year to complete, so it won't happen over night. All of this will be done in 3 main waves structure blue, red, green. First structure is initial path upwards, then the second structure is the pullback and the third structure is the final upleg to around $5.30.
Value, Safety, Timing Stock FMGFMG.AX is in the list of Top VST Stocks in VectorVest on 21-Aug
RV = 1.66
RS = 0.97
RT = 1.51
VST = 1.40
CI = 0.71
The Relative Timing values of FMG has been settled less than 1.0 nearly 5 months
RT crossover occurred first time after 5 months on 21-Aug from 0.88 to 1.51 that show a strong buy signal
BTW, the structure of inverted H&S has completed, and recently re-tested $5.44, FMG.AX can reach $6.35.
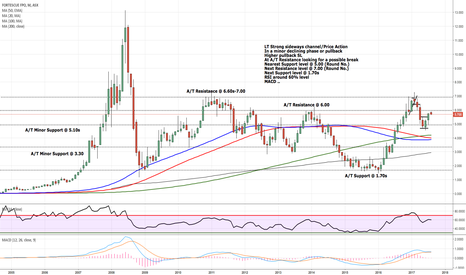
All time chart of FMG to be followed by medium/short term chartsLT Strong sideways channel/Price Action
In a minor declining phase or pullback
Higher pullback SL
At A/T Resistance looking for a possible break
Nearest Support level @ 5.00 (Round No.)
Next Resistance level @ 7.00 (Round No.)
Next Support level @ 1.70s
RSI around 60% level
MACD ..


