INDIA: Winner of Trade War?India could benefit from a global trade war due to its low trade-to-GDP ratio, meaning it has less to lose and more to gain by becoming an alternative manufacturing hub
Key stats
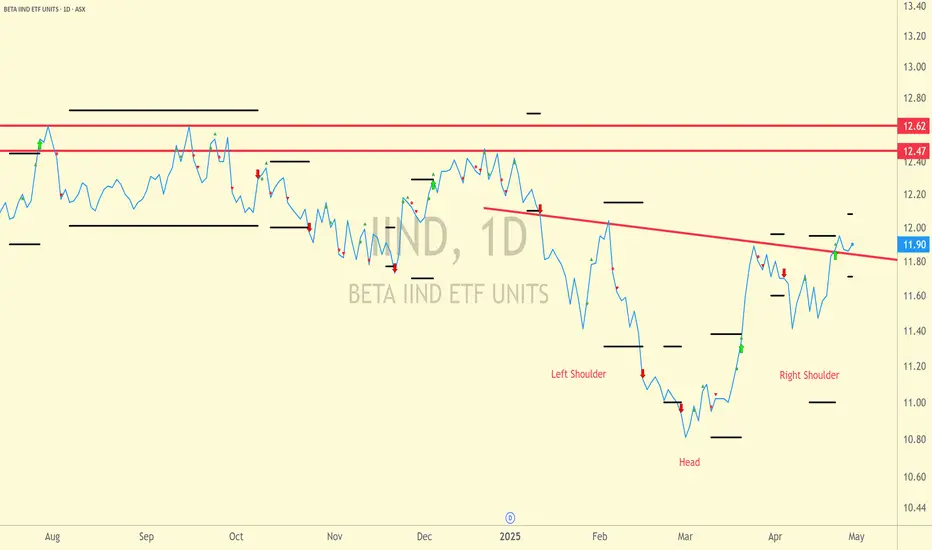
About BETA IIND ETF UNITS
Home page
Inception date
Aug 2, 2019
Replication method
Physical
Dividend treatment
Distributes
Income tax type
Capital Gains
Primary advisor
BetaShares Capital Ltd.
ISIN
AU0000053126
IIND aims to track the performance of an index (before fees, expenses and taxes) comprising a diversified portfolio of the highest quality Indian companies.
Related funds
Classification
What's in the fund
Exposure type
Finance
Technology Services
Consumer Non-Durables
Consumer Durables
Stock breakdown by region
Top 10 holdings
IAA.AX ETF @ CRISPY POTATO
THE COMBINED PROBABILITY OF FOR APRIL 2022 = BEAR (Week 1 Bull)
WEEK
The probability for the next week is BULL
Week 1 of March produced a Bear candle with almost no tails, indicating a lack of support to reject lower prices. In week 2 the Bulls engaged and offered support for the week, it was

See all ideas
Summarizing what the indicators are suggesting.
Oscillators
Neutral
SellBuy
Strong sellStrong buy
Strong sellSellNeutralBuyStrong buy
Oscillators
Neutral
SellBuy
Strong sellStrong buy
Strong sellSellNeutralBuyStrong buy
Summary
Neutral
SellBuy
Strong sellStrong buy
Strong sellSellNeutralBuyStrong buy
Summary
Neutral
SellBuy
Strong sellStrong buy
Strong sellSellNeutralBuyStrong buy
Summary
Neutral
SellBuy
Strong sellStrong buy
Strong sellSellNeutralBuyStrong buy
Moving Averages
Neutral
SellBuy
Strong sellStrong buy
Strong sellSellNeutralBuyStrong buy
Moving Averages
Neutral
SellBuy
Strong sellStrong buy
Strong sellSellNeutralBuyStrong buy
Displays a symbol's price movements over previous years to identify recurring trends.
Frequently Asked Questions
An exchange-traded fund (ETF) is a collection of assets (stocks, bonds, commodities, etc.) that track an underlying index and can be bought on an exchange like individual stocks.
IIND trades at 11.85 AUD today, its price has fallen −1.09% in the past 24 hours. Track more dynamics on IIND price chart.
IIND net asset value is 12.00 today — it's risen 0.97% over the past month. NAV represents the total value of the fund's assets less liabilities and serves as a gauge of the fund's performance.
IIND assets under management is 229.52 M AUD. AUM is an important metric as it reflects the fund's size and can serve as a gauge of how successful the fund is in attracting investors, which, in its turn, can influence decision-making.
IIND price has fallen by −0.92% over the last month, and its yearly performance shows a −2.47% decrease. See more dynamics on IIND price chart.
NAV returns, another gauge of an ETF dynamics, showed a 4.13% increase in three-month performance and has increased by 0.81% in a year.
NAV returns, another gauge of an ETF dynamics, showed a 4.13% increase in three-month performance and has increased by 0.81% in a year.
IIND fund flows account for 40.51 M AUD (1 year). Many traders use this metric to get insight into investors' sentiment and evaluate whether it's time to buy or sell the fund.
Since ETFs work like an individual stock, they can be bought and sold on exchanges (e.g. NASDAQ, NYSE, EURONEXT). As it happens with stocks, you need to select a brokerage to access trading. Explore our list of available brokers to find the one to help execute your strategies. Don't forget to do your research before getting to trading. Explore ETFs metrics in our ETF screener to find a reliable opportunity.
IIND invests in stocks. See more details in our Analysis section.
IIND expense ratio is 0.80%. It's an important metric for helping traders understand the fund's operating costs relative to assets and how expensive it would be to hold the fund.
No, IIND isn't leveraged, meaning it doesn't use borrowings or financial derivatives to magnify the performance of the underlying assets or index it follows.
In some ways, ETFs are safe investments, but in a broader sense, they're not safer than any other asset, so it's crucial to analyze a fund before investing. But if your research gives a vague answer, you can always refer to technical analysis.
Today, IIND technical analysis shows the strong sell rating and its 1-week rating is buy. Since market conditions are prone to changes, it's worth looking a bit further into the future — according to the 1-month rating IIND shows the neutral signal. See more of IIND technicals for a more comprehensive analysis.
Today, IIND technical analysis shows the strong sell rating and its 1-week rating is buy. Since market conditions are prone to changes, it's worth looking a bit further into the future — according to the 1-month rating IIND shows the neutral signal. See more of IIND technicals for a more comprehensive analysis.
Yes, IIND pays dividends to its holders with the dividend yield of 0.59%.
IIND trades at a premium (0.24%).
Premium/discount to NAV expresses the difference between the ETF’s price and its NAV value. A positive percentage indicates a premium, meaning the ETF trades at a higher price than the calculated NAV. Conversely, a negative percentage indicates a discount, suggesting the ETF trades at a lower price than NAV.
Premium/discount to NAV expresses the difference between the ETF’s price and its NAV value. A positive percentage indicates a premium, meaning the ETF trades at a higher price than the calculated NAV. Conversely, a negative percentage indicates a discount, suggesting the ETF trades at a lower price than NAV.
IIND shares are issued by BetaShares Holdings Pty Ltd.
IIND follows the Solactive India Quality Select Index - INR. ETFs usually track some benchmark seeking to replicate its performance and guide asset selection and objectives.
The fund started trading on Aug 2, 2019.
The fund's management style is passive, meaning it's aiming to replicate the performance of the underlying index by holding assets in the same proportions as the index. The goal is to match the index's returns.