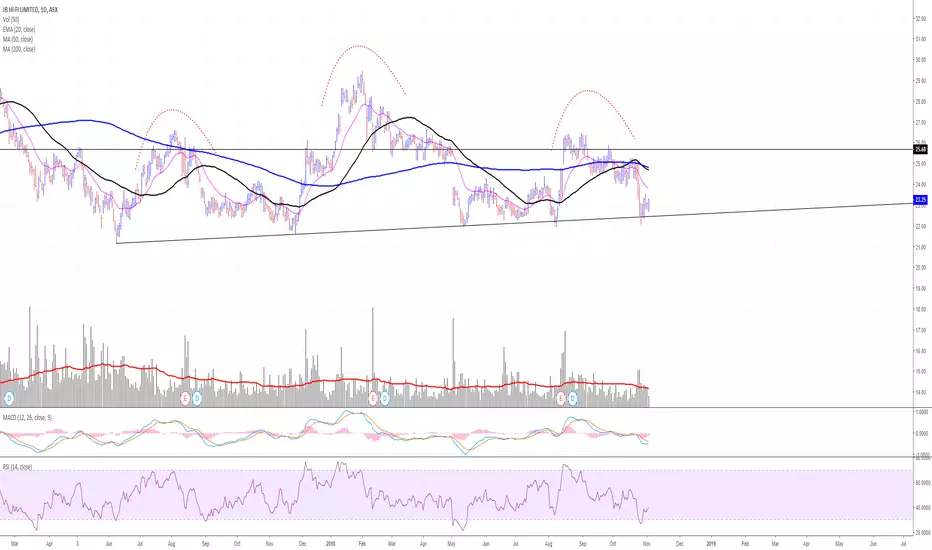
Is the distribution pattern on JBH now complete? (JBH:ASX)* Initial peak at the end of 2021
* Sharp retrace (automatic reaction) followed by quick rally into the secondary test
* Sharp fall again on most bearish volume in that period
* Long phase B of about 12 months
* Down moves so much quicker than the up moves
* Distribution occurring through this period
* Ultimate high in April 2022 forming an upthrust after distribution
* Very weak retest to complete Phase C
* Rapid decline in price from $57 to $37 approx in Phase D sell off
* One last rally to $47 approx
* Back up to the creek and upthrust to complete Phase D
* We should now start the Phase E mark down.
* P&F target is $10, conservative target $21
* This is my analysis of the stock. DYOR before making trades.
JBH trade ideas

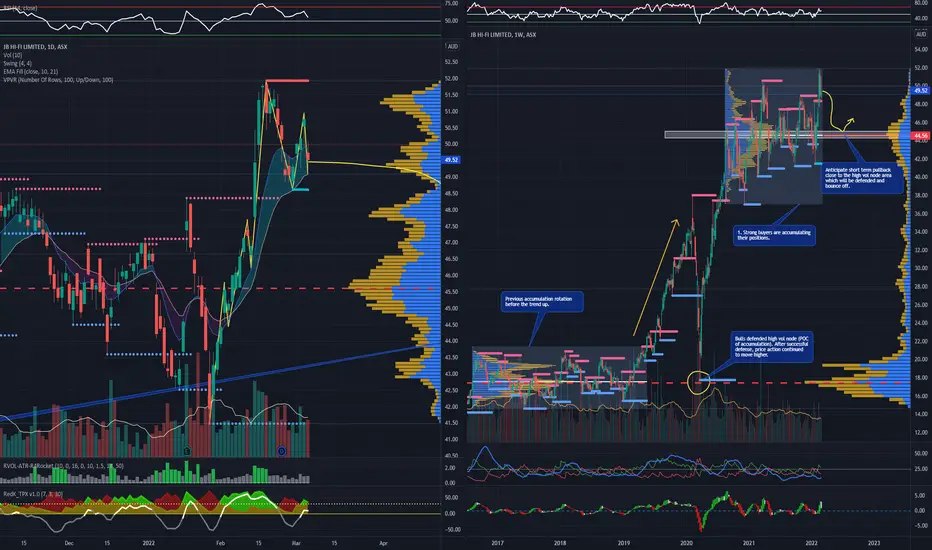
JBH - Vol Profile analysisASX:JBH
Analysis of JBH and observed a potential swing trade using fixed range volume profile.
See notes on chart.
comparing ASX retail stocks. supermarkets chart diff 2 othersthis chart might be too busy, fundamentally Supermarkets (COL & WOW) chart differently to electronics/entertainment (HVN & JNH) which chart differently to


Bullish JB HiFi - Buy at pullbackJB HiFi is going to go up over the next few weeks.
Fundamentals
- Promising Australian economic data ie skyrocketing consumer confidence, JobKeeper payments are 50% unused meaning potential demand, good May PMI's, retail sales beating expectations -----> suggesting recovering in spending
- relatively isolated from geopolitical risk ie main market is Australia/NZ, supply chain protected with excess stock/inventory ----> hedge against unwanted risk
- JB HiFi is heavily stocked on electronics ---> supporting the growing/prolonged work from home trend ----> hedged from geopolitical concerns, cash flow concerns
- Stock has rallied from March low and now in an uptrend ----> market's support for the business at this time
- Major indices are rallying -----> supporting economic reopening hopes
Technicals
- 20 day MA crossing over 50 day MA and 200 day MA ----> bullish indicator
- MACD & RSI trending upwards -----> bullish indicator
- 20 day MA now support


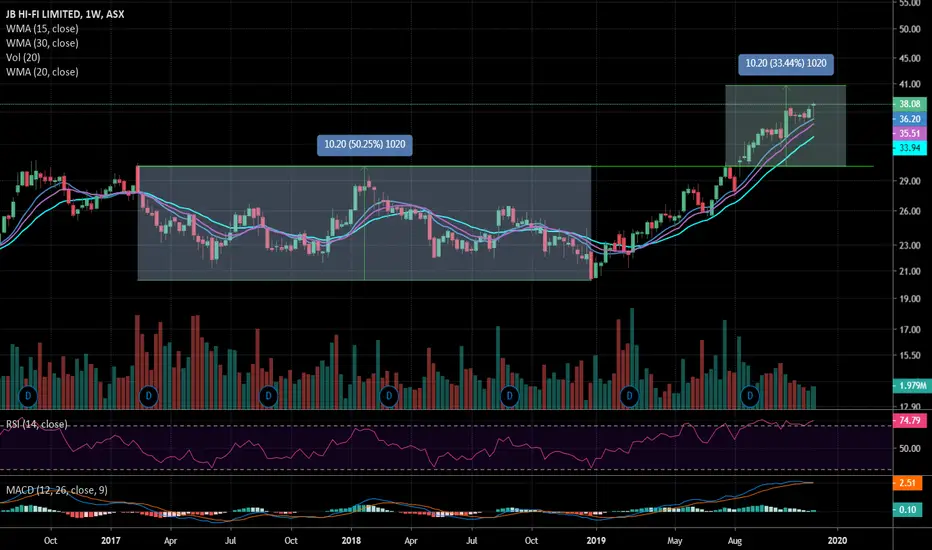
$JBH LONG target $40.70Such a good setup; when a long term weekly resistance point is broken. Measured move is $10.20, giving a final target of $40.70.
PERFECT WYCKOFF RE-ACCUMULATION - JB HI-FI (JBH:ASX)By September 2016, JB Hi-Fi was flying hitting a high of $31. Over the next 6 months the stock would pull back and have a second attempt to rally to new high's without success. This triggered a sell off down to $21.20.
By June 2017 we had seen an increase in supply levels and overall increase in volume until the climax. A nice strong automatic rally from $21 saw the price reach $26. If you look closely at the volume each leg higher of the automatic rally, the volume was getting lighter. Suggesting the rally was weakening. Price completed Phase A of the re-accumulation with a secondary test. Note the volume was certainly getting less. Phase A of the process halts the downside movement of the stock.
Throughout Phase B we see the volatility in the stock with swings to $30 and back to $22. What is key though is as we move through phase B, the moves to the downside and those large volume spikes are getting lighter each time. We are starting to see a transfer of stock from weak hands to strong hands.
In January 2019, we see the first break of the selling climax in 18 months. Look at the lack of volume once it breaks. It's a break of a significant level yet there is no selling evident. The price jumps straight back above it and moves away from the danger area. The volume builds. We have seen our confirmed spring.
Late February we retest the selling climax area, and price holds, showing strength in the stock. This is the first area of the phases that we look to take trades. It is the lowest risk area with your stop below the spring. Take notice of how the retest of the selling climax is also a retest of the supply line of the smaller downward trend channel formed in phase B. Phase C of the process is complete.
Price moves away on strong demand and we are now in phase D. Now we notice that pullbacks are on very light volume. The professionals will not bring the price back down and give buyers the chance to get the price cheaper, there going to have to bid this up. We see a sign of strength as the price breaks the top of the trading range on a strong move.
Price dips once more below the trading range to shake out any weak holders and phase E begins. We now have our last point of support and the stock is ready for mark up.
We see a back up to the creek of only a few days and then price takes off after good news from earnings which always seems to be the case when the stock is in strong hands.
We are now seeing the volume getting lighter as we move higher which isn't a bad thing as we now have strength in the background and supply has to show itself. If it doesn't the stock will continue to grind higher. If we do see supply come in in the near future, the stock may form a smaller trading range before moving higher again.
The Point & Figure chart suggests that there is enough cause to move the stock to the $42 level.

$JBH:ASX - JB HIFI - 3rd Test of Resistance. Breakout?This is its 3rd time that it has tested that $27.60 resistance area and looks to have finally broken through. Looks like the momentum is there finally and with 93 buyers for 72,442 units vs 36 sellers for 18,791 units hopefully it will hold and continue its run. Might be worth a watch.
JB Hi-Fi Limited (JB Hi-Fi) is engaged in the retailing of home consumer products. The Company has two segments: Australia and New Zealand. It is involved in the sale of consumer electronics products and services, including televisions, audio equipment, computers and cameras; software, including Compact Discs (CDs), Digital Versatile Discs (DVDs), Blu-ray discs and game; whitegoods, cooking products and small appliances; telecommunication products and services; musical instruments, and digital video content. The Company also offers information technology and consulting services. The Company has approximately 60 JB Hi-Fi Home branded stores, including over four in New Zealand. The Company operates approximately 190 physical stores. The Company offers various solutions, such as corporate, government and education sales of products and services, and insurance replacements. The Company also offers JB Hi-Fi Home roll-out. The Company has approximately 40 stores with small appliances.


JBH Potential Topping H&S PatternRetail has been nothing but a disappointment over the recent reporting season, i expect JBH to follow its peers.