Potential key reversal bottom detected for JHXAwait signals for entry such as DMI/ADX and/or RSI swing to the bullish direction.
Stop loss for the trade involving ASX:JHX (and indication that this trade is an absolute 'no-go') is any trade below the low of the signal day of 21st March (i.e.: any trade below $45.52).
JHX trade ideas

JHX @ 16 NOV 2021Text me if you have any questions/comments for me.
-----
JHX
- Previous video analysis was done on 13 Nov (red arrow) - Suggested waiting for a retracement and a successful rebound
- Since then, the stock briefly created a new high and currently looks like it’s retracing
- Another healthy test of the short-term support will bode well for the uptrend of the stock
- At the moment, a successful rebound look to be around 56.50
- R is less than 10%
- Strategy-to-buy (DYOR) – Suggest waiting for a retracement and successful rebound

JHX @ 27 OCT 2021Text me if you have any questions/comments for me.
-----
JHX
- Previous analysis was done on 16 Sep (red arrow) - Suggested entry around 54.90 levels if believe the stock can create new all-time highs
- Since then, the stock did not rebound to $54.90 but instead broke through the short- and mid-term supports and tested the resistance-turned-support at $47 levels (orange line)
- Stock looks to be rebounding with most indicators showing positive signs
- Today, the stock retraced to test the short-term support
- A successful rebound look to be around 52.50 levels
- Overhead resistance zone at 54-55 levels (blue highlighted zone) -> Any entry below this strong resistance will be on the belief that the resistance can be broken
- R is less than 10%
- Strategy-to-buy (DYOR) – Suggest half entry after successful rebound if believe the stock is capable of breakout of strong resistance zone

JHX @ 16 SEP 2021Text me if you have any questions/comments for me.
-----
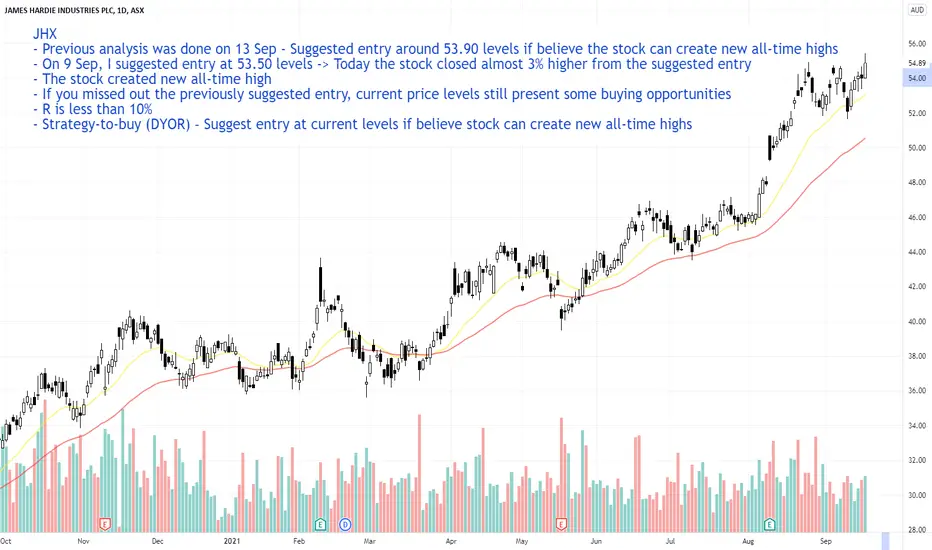
JHX
- Previous analysis was done on 13 Sep - Suggested entry around 53.90 levels if believe the stock can create new all-time highs
- On 9 Sep, I suggested entry at 53.50 levels -> Today the stock closed almost 3% higher from the suggested entry
- The stock created new all-time high
- If you missed out the previously suggested entry, current price levels still present some buying opportunities
- R is less than 10%
- Strategy-to-buy (DYOR) – Suggest entry at current levels if believe stock can create new all-time highs
JHX @ 13 SEP 2021JHX
- Previous analysis was done on 9 Sep - Suggested entry around 53.50 levels
- Recent price retracement has seen the stock test the short-term support and successfully rebounded
- If you missed out the previously suggested entry, current price levels still present some buying opportunities
- R is less than 10%
- Strategy-to-buy (DYOR) – Suggest entry at current levels if believe stock is capable of creating new all-time highs

JHX @ 1 SEP 2021JHX
- First time doing a written analysis on JHX
- Nice uptrend over the last few months
- Stock is trading near all-time high regions
- A pullback to the short-term support would be better for the overall health of the trend
- A successful rebound look to be around 54 levels
- R is less than 10%
- Strategy-to-buy (DYOR) – Suggest waiting near 54 levels if believe the stock is capable of creating new all-time highs

JHX - We could get a pullback.JHX is in a confirmed uptrend but the current price action seems exhaustive. As we can see bearish candle at the top and Overbought RSI, it could pullback lower to offer a swing low.
I have two buy zones (1st Buy Zone between $42.0 - $43.50) and (2nd Buy Zone between $37.70 - $38.70), where I think price may come to test as these are previous Resistance zones or congestion zones. I would monitor price action at either of the two levels and would buy after bullish price action confirmation to ride the next swing.
Please note these are my own notes, by no means trading advice. Please do your own research before entering into any trade.

$JHX with a slight Bearish outlook after earnings$JHX with a negative under reaction following its earnings with PEAD projecting a slight bearish outlook as price is currently trading above the Projected PEAD cone upper boundary.
If you would like to see the Drift for another stock please message us. Also click on the Like Button if this was useful and follow us or join us.

JHX Company Info and future growth:
James Hardie Industries plc, together with its subsidiaries, manufactures and sells fiber cement siding and backer board products primarily in the United States, Canada, Australia, New Zealand, the Philippines, and Europe.
Earnings : JHX's forecast earnings growth at least 20.6% per year
Earnings: Earnings are expected to grow significantly over the next 3 years.
Revenue : JHX's revenue is expected to grow 7.1% per year
Expected Target: $34

TUrtle soup / The Anty / volume profile
This is a double signal short today,
1. Turtle soup > new 20 day high and reversal bar below old high around 27.85
2. The Anty ( modified Stochastic) shows an declining Stoch line, with over- bought levels showing time for reversal...
This is a scalp for correction of ' similar degree' to previous correction > target is in price & volume 'point of control' on volume profile.

SHort / Put on JHX ( ASX200) - Turtle soup failure 20 day HiggThis is taking advantage of a Failure at new 20 day high, it beat 4 days ago,
but has corrected quickly back in....shows weakness.
I prefer Put options due to risk of false break out again at highs if pushes up one more time in next few days;
I figure June expiry is enough time and only looking for a 4% correction obvious support $1.00 below or more...
For $400 risk, I can profit about $250 after brokerage if works out.
I bought 500 slightly out of money puts with a delta of 0.43 gives position size equivalent of $ 6800 worth.

James Hardie Industries PLC (JHX - Sydney) ABC zigzag wave patteJames Hardie Industries PLC (JHX - Sydney) is moving down in ABC zigzag pattern, where B wave was complex wave. Wave C is started going down with relative higher volume and will form five wave sequence down. It is already completed 2nd wave and going down as 3rd wave with gap on chart.

$JHX:ASX - JAMES HARDIE INDUSTRIES - Trending nicely up 90%James Hardie has been having a nice run. Small pullback back under 32 but showing better value. Trades in a nice and tight range with about a 6% trailing sell keeping you in the stock most of the time. Could be worth a watch.
James Hardie Industries Plc engages in the manufacture of fiber cement siding and backerboard. It operates through the following segments: North America Fiber Cement, International Fiber Cement, Other Businesses and Research and Development. The North America Fiber Cement segment manufactures fiber cement interior linings, exterior siding products, and related accessories in the United States. The International Fiber Cement segment comprises of all fiber cement products manufactured in Australia, New Zealand, and the Philippines, and sold in Australia, New Zealand, Asia, the Middle East, and various Pacific Islands. The Other Businesses segment focuses in the certain non-fiber cement manufacturing and sales activities in North America, including fiberglass windows. The Research and Development segment represents the cost incurred by the research and development centers. The company was founded in 1888 and is headquartered in Dublin, Ireland.

Wedge pullback patternNice developed down trend with a pullback wedge pattern forming. Volume is also contracting on the pullback indicating buying in the pullback is weakening.
Enter if price breaks below the wedge pattern. Target is the same distance from the previous pullback, unless a pivot point price action appears.


Survivor of the biggest point drop In History #7 (JHX)This idea match with some of the rules that I have for publishing (resistance breakout and price pullback) but the Average-Volume is: 27,391
For Large traders this stock is Illiquid. is at the discretion of the trader to follow this idea and make your math.
I comply with my part that is find Price Patterns
www.investopedia.com
