Buy Idea for MQG (Macquarie Group Ltd)📈 Buy Idea – MQG.ASX
🔹 Entry: $210.49
🔹 Stop: $201.80 (Risk ~4.1%)
🔹 Target 1: $227.50
🔹 Target 2: $238+
🔹 R:R: ~1:3
Setup:
– Tight sideways consolidation near 50MA
– Strong volume support near $205 zone
– Bullish engulfing candle into breakout zone
– Sector strength: Financials stabilizing post RBA cut
– Clean technical base + upside momentum potential
Why It Works:
🔸 High-quality name with macro tailwind (lower rates = banking boost)
🔸 Tight risk with upside if it breaks out above $215
🔸 Good institutional interest & dividend tailwind
🚨 Trigger Alert: Add above $215 for momentum confirmation
🔔 Monitor closely for follow-through above resistance
DISCLAIMER : The content and materials featured are for your information and education only and are not attended to address your particular personal requirements. The information does not constitute financial advice or recommendation and should not be considered as such. Risk Management is Your Shield! Always prioritise risk management. It’s your best defence against losses.
MQG trade ideas

Buying idea MQG with stop at 221MQG have recovered after earnings and dividend shakeouts. have build a decent base above 50 day MA and now looking to break though. let's test this with a decent stop at 221.
DISCLAIMER : The content and materials featured are for your information and education only and are not attended to address your particular personal requirements. The information does not constitute financial advice or recommendation and should not be considered as such.

Buying MQG stop at 225buying MQG stop at 225. price consolidated at peak for a while and looking to move up again. overall mkt strong and this share should look to break through new highs with mkt.

ASX - MQG: 21 JUNE, 2024© Master of Elliott Wave Analysis: Hua (Shane) Cuong, CEWA-M
Details: The short-term outlook shows that wave (iii)-orange is unfolding to push higher, towards the immediate target at 205.45.
Invalidation point: 155.30

Macquarie group - positional longStock is making a rounding bottom that indicates accumulation & getting ready to break the next big resistance.
Daily closing above 183 can lead to 192 and 200 levels. Keep a stop loss below 174 in this trade. If a closing comes above 200 levels, then stock price can increase by 10-15 % very quickly because all previous gaps will be filled and weaker hands would have been exited earlier.

Macquarie Ltd AustraliaSun Storm Investment Trading Desk & NexGen Wealth Management Service Present's: SSITD & NexGen Portfolio of the Week Series
Focus: Worldwide
By Sun Storm Investment Research & NexGen Wealth Management Service
A Profit & Solutions Strategy & Research
Trading | Investment | Stocks | ETF | Mutual Funds | Crypto | Bonds | Options | Dividend | Futures |
USA | Canada | UK | Germany | France | Italy | Rest of Europe | Mexico | India
Disclaimer: Sun Storm Investment and NexGen are not registered financial advisors, so please do your own research before trading & investing anything. This is information is for only research purposes not for actual trading & investing decision.
#debadipb #profitsolutions

MQG Buy Zone $148-164Forever collecting this one. Long-term hold as it has always trended upwards.
They are one of the largest investors in renewable energy which has a chance to really take off in our current climate...no pun intended.

MQG to the moon?I tried to find some measured moves in MQG. the two lines marked "=" were the first two I found. I also over laid the same measure on two earlier ramps.
It does look like tat measured move could spell the end of the run of MQG for the time being?
I don't use fundamentals, but I would be keen to hear what could be driving this? Is money going to MQG from the other banks???

current price looks overvaluedcurrent price looks overvalued, it may down to 175 level.
Mqg have the potential to go 246 in the long run

MQG @ 4 NOV 2021Text me if you have any questions/comments for me.
-----
MQG
- Previous analysis was done on 23 Sep (red arrow) -> Suggested entry around $178 levels if believe the stock can create new all-time highs
- Since then, the stock tested the $182 resistance for 2 weeks before breaking out strongly
- The stock has also had a weak test of the short-term support and has successfully rebounded
- If you have taken the recommendation, you would in profit of around 13% after 6 weeks -> the returns strengthen the previous analysis that the stock fits investors/traders with a more conservative risk appetite
- Currently, a good setup for entry has presented itself
- R is less than 10%
- Strategy-to-buy (DYOR) – Suggest entry at current levels if believe the stock can create new all-time highs

MQG @ 23 SEP 2021Text me if you have any questions/comments for me.
-----
MQG
- First time doing a written analysis on MQG
- Stock has a history of uptrend that is punctuated with sideways movements
- Usually, a low volatility stock that doesn’t have strong pullbacks (less than 10%)
- Stock would fit traders/investors who have a longer time horizon (ie. A few months)
- Recent test of the short-term support and subsequent rebound has provided a potential rebound entry
- R is less than 10%
- Strategy-to-buy (DYOR) – Suggest entry above today’s high if believe the stock is capable of creating new all-time highs

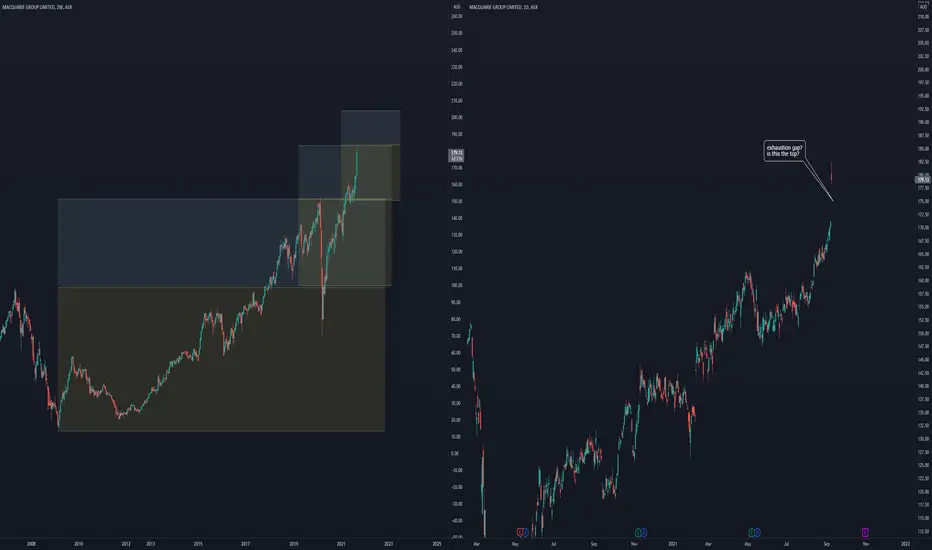
topping signal is in for MQG1. there is an exhaustion gap on the daily chart. (bearish)
2. fibonacci levels show a resistance level has been met. (2 week chart)
Macquarie hedgeI'll use MQG as a hedge against my current long stonks position.
MQG has been highly re-active to the previous sell-off & since recovery.
I'll be buying PUTS (out of the money) upon confirmation

Trading Diary - August MQG trading strategyThis post is purely for recording my self trading actions. Not an advice to anyone.

MQG, fill the gap and collapsestill bearish on MQG.
need more debt creation to make money.
people are saturated in debt.
.5% cash rate and home loans @ 2% are help
MQG stay high. intrinsic value of MQG is close
to $10

bear call spread ( credit)
I think the financial sector has topped out for now and with a potential leg C in an ABC correction,
I could have 3 weeks of this price remaining under the sold portion @ 124 strike ( european)
10 ( 1000 shares) bear credit spread strikes -124 / +126 yields a tidy $780 before costs for 3 weeks time until 15 July.....

Next two weeks updatesPull back (lower trend line) in the next few days in the chance to increase holding. stop loss at $118-119. take profit in stages up to $127.
I'm a long term investor on this stock. I'm using this opportunity to slightly increase my holdings.

dead cat bounce?MQG has bounced nicely from the crash sell off.
i guess it could make new highs if RBA starts buying
shares. who knows coz its not a market economy anyway

if MQG breaks $90, its heading lower.yeah. its game over for MQG.
should have sold out @ the dead cat bounce.
its heading lower ...

MQG failing to break throughMQG seems to be struggling to break out of the bear momentum established over the whole market.
The run from the low of $85 to the recent high of $102ish attempted to pierce the longer band of GMMAs, but has been rejected. This rejection occured just a little above the 0.382 fib retracement line. Note this is also the support found in December 2018 turning into resistance.
Note also that OBV would appear to be downtrending with a LL formed to coincide with the test of the fib/GMMA/resistance point.
This idea would become invalid if price can exceed the 0.382 fib level and find support, in so doing breaking into the long GMMA band

MQG more bearish momentum to come Lack of momentum across the popular indicators + large bear engulfing candle, in my opinion lower lows to come lower bb sitting around $62 which aligns with long term support

MQG and fibanacciFibonacci timezones + levels show
MQG buyers are reaching exhaustion point.
RBA got your back MQG?

