NAB Monthly Long term structureElliotticians, don't crucify me... I'm no expert in EW theory!
But I believe we are seeing a super high level double or triple three pattern emerging in NAB
Long term it appears that NAB was in a trending pattern till 2009
Currently we are in a long term corrective phase, which consists of large Fl
Key stats
About NATIONAL AUSTRALIA BANK LIMITED
Sector
Industry
CEO
Andrew Irvine
Website
Headquarters
Melbourne
Founded
1893
ISIN
AU0000124042
FIGI
BBG00Y6QDTJ3
National Australia Bank Ltd. engages in the provision of banking and financial services. Its services include banking, credit and access card facilities, leasing, housing and general finance, international banking, investment banking, wealth management, funds management and custodian, trustee and nominee services. It operates through the following segments: Business and Private Banking, Personal Banking, Corporate and Institutional Banking, New Zealand Banking, and Corporate Functions and Others. The Business and Private Banking segment focuses on priority small and medium (SME) customers. The Personal Banking segment provides banking products and services to customers. The Corporate and Institutional Banking segment includes client coverage, corporate finance, markets, asset servicing, transactional banking and enterprise payments. The New Zealand Banking segment focuses on banking and financial services across customer segments in New Zealand. The Corporate Functions and Other segment covers ubank and enabling units. The company was founded on October 4, 1858 and is headquartered in Melbourne, Australia.
Related stocks

Buy NAB 37 stop at 35.50buying NAB given the price consolidation around this level. again going for a tight stop of 4%. overall market is positive and banking sector will need to support this move. NAB price action looking good just broke off 50 day MA. We could see price moving up from here to all time highs.

NAB.ASX: 23 AUG, 2024 Master of Elliott Waves: Hua (Shane) Cuong, CEWA-M.
Since the low at 34.67, wave (iii)-orange is unfolding to push higher, which itself is subdividing into waves ((1)),((2))-navy and currently wave (1)-orange. Wave (2)-orange will soon unfold to push a little lower, and finally wave (3)-orange will

ASX - NAB: 7 June, 2024© Master of Elliott Wave Analysis: Hua (Shane) Cuong, CEWA-M
The short-term outlook shows that wave ((iv))-navy ended earlier than expected, and wave ((v))-navy opened to push higher, it is subdividing into wave (i),( ii)-orange, and they have concluded, now it is time for wave (iii)-orange to open

ASX - NAB: 26 APR, 2024© Master of Elliott Wave Analysis: Hua (Shane) Cuong, CEWA-M.
Details: The shorter-term outlook suggests that the ((iii))-green wave has recently peaked, and the ((iv))-green wave has unfolded in the form of a Flat correction, with the ((iv))-wave likely completed. The ((v))-green wave is now unfol

NAB IDEA HELLO GUYS THIS MY IDEA 💡ABOUT NAB is nice to see strong volume area....
Where is lot of contract accumulated..
I thing that the buyers from this area will be defend this LONG position..
and when the price come back to this area, strong buyers will be push up the market again..
UP TREND + Resist

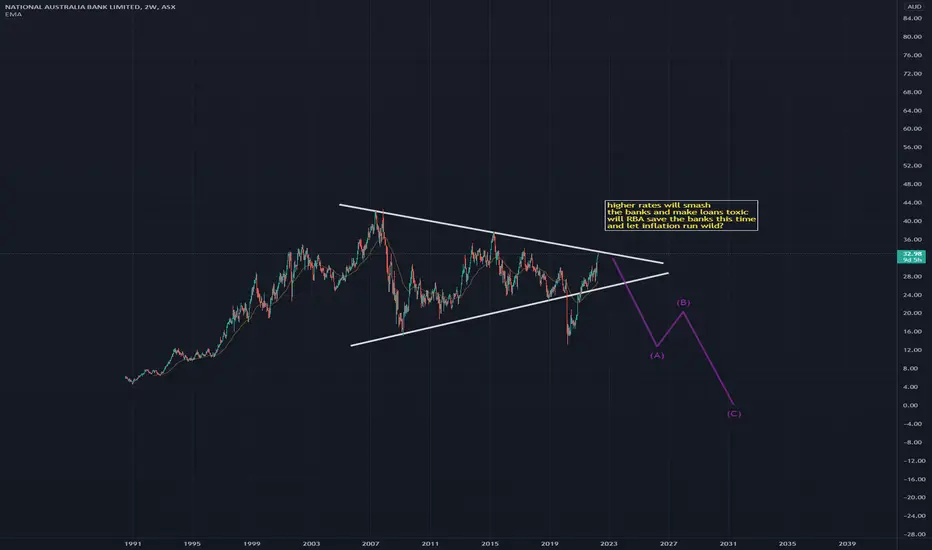
will RBA step in?NAB hitting resistance level. time to sell.
fianance is really political rather than economics.
RBA has to step in to save the banks from getting smashed.
if rates rise all those loans will be liabilities and
the banks who make up most of the index will get smashed
NAB - MACD Daily Histogram above 0 for 25 Consecutive DaysThe National Australia Bank Ltd (ASX:NAB) MACD Histogram (12, 26, 9) has just recorded 25 consecutive days above 0. Since 2000, this type of indicator persistence above 0 when trading above its 200-day moving average, was usually the forerunner to some short-term upside.
The 6-day average absolute


NAB Long after breaking out of consolidationEntry: 27.23
Stop loss: 26.70
Went long after it broke out after a period of consolidation with above average volume.
Note that the earnings will be released the following day though.

See all ideas
Summarizing what the indicators are suggesting.
Oscillators
Neutral
SellBuy
Strong sellStrong buy
Strong sellSellNeutralBuyStrong buy
Oscillators
Neutral
SellBuy
Strong sellStrong buy
Strong sellSellNeutralBuyStrong buy
Summary
Neutral
SellBuy
Strong sellStrong buy
Strong sellSellNeutralBuyStrong buy
Summary
Neutral
SellBuy
Strong sellStrong buy
Strong sellSellNeutralBuyStrong buy
Summary
Neutral
SellBuy
Strong sellStrong buy
Strong sellSellNeutralBuyStrong buy
Moving Averages
Neutral
SellBuy
Strong sellStrong buy
Strong sellSellNeutralBuyStrong buy
Moving Averages
Neutral
SellBuy
Strong sellStrong buy
Strong sellSellNeutralBuyStrong buy
Displays a symbol's price movements over previous years to identify recurring trends.
XS0832596711
NatlAustraliaBk 100 27/09/2042Yield to maturity
14.82%
Maturity date
Sep 27, 2042
XS0752953322
NatlAustraliaBk 100 01/03/2042Yield to maturity
11.24%
Maturity date
Mar 1, 2042
XS0885644723
NatlAustraliaBk 100 05/02/2033Yield to maturity
11.21%
Maturity date
Feb 5, 2033
XS0903865656
NatlAustraliaBk 100 20/03/2043Yield to maturity
8.33%
Maturity date
Mar 20, 2043
NABZ5106952
National Australia Bank Limited 2.648% 14-JAN-2041Yield to maturity
6.74%
Maturity date
Jan 14, 2041
XS2657847393
NatAusBk 4.651% 33Yield to maturity
6.15%
Maturity date
Jul 26, 2033
XS2503901659
NatAusBk 6.15% 37Yield to maturity
6.15%
Maturity date
Jul 20, 2037
XS2434806126
NatAusBk 2.54% 29Yield to maturity
5.74%
Maturity date
Jan 20, 2029
NABZ5975041
National Australia Bank Limited 5.902% 14-JAN-2036Yield to maturity
5.68%
Maturity date
Jan 14, 2036
AU3FN005158
NATL AUSTR.B 19/29 FLRYield to maturity
5.66%
Maturity date
Nov 18, 2031
XS2777451274
NatAusBk 5.64% 34Yield to maturity
5.64%
Maturity date
Mar 5, 2034
See all NABPH bonds
Frequently Asked Questions
The current price of NABPH is 103.430 AUD — it has decreased by −0.01% in the past 24 hours. Watch NAT. BANK NYR3QUT stock price performance more closely on the chart.
Depending on the exchange, the stock ticker may vary. For instance, on ASX exchange NAT. BANK NYR3QUT stocks are traded under the ticker NABPH.
NABPH stock has risen by 0.36% compared to the previous week, the month change is a −0.69% fall, over the last year NAT. BANK NYR3QUT has showed a −0.54% decrease.
NABPH reached its all-time high on Dec 29, 2021 with the price of 107.080 AUD, and its all-time low was 98.060 AUD and was reached on Jun 14, 2022. View more price dynamics on NABPH chart.
See other stocks reaching their highest and lowest prices.
See other stocks reaching their highest and lowest prices.
NABPH stock is 0.20% volatile and has beta coefficient of 0.09. Track NAT. BANK NYR3QUT stock price on the chart and check out the list of the most volatile stocks — is NAT. BANK NYR3QUT there?
No, NABPH doesn't pay any dividends to its shareholders. But don't worry, we've prepared a list of high-dividend stocks for you.
Like other stocks, NABPH shares are traded on stock exchanges, e.g. Nasdaq, Nyse, Euronext, and the easiest way to buy them is through an online stock broker. To do this, you need to open an account and follow a broker's procedures, then start trading. You can trade NAT. BANK NYR3QUT stock right from TradingView charts — choose your broker and connect to your account.
Investing in stocks requires a comprehensive research: you should carefully study all the available data, e.g. company's financials, related news, and its technical analysis. So NAT. BANK NYR3QUT technincal analysis shows the neutral today, and its 1 week rating is sell. Since market conditions are prone to changes, it's worth looking a bit further into the future — according to the 1 month rating NAT. BANK NYR3QUT stock shows the strong sell signal. See more of NAT. BANK NYR3QUT technicals for a more comprehensive analysis.
If you're still not sure, try looking for inspiration in our curated watchlists.
If you're still not sure, try looking for inspiration in our curated watchlists.