$PLL longPiedmont Lithium has been on a tear recently. i would be long here. I would also expect a little bit of digestion around the 16.65 level (+10%), maybe even pulling back a little bit from there. However, if it does break thru the purple resistance line, it should be a quick move to the next resistance zone around 23.90 (+60%) , as there is not much volume activity between the purple line and the blue line. Piedmont Lithium is a low float stock (17.8M) as well as it being highly shorted (almost 19% short). These 2 data points could cause Piedmont Lithium to really take off, as the shorts would have to cover. More info on short squeezes can be found on the internet at websites such as investopedia.
PLL trade ideas


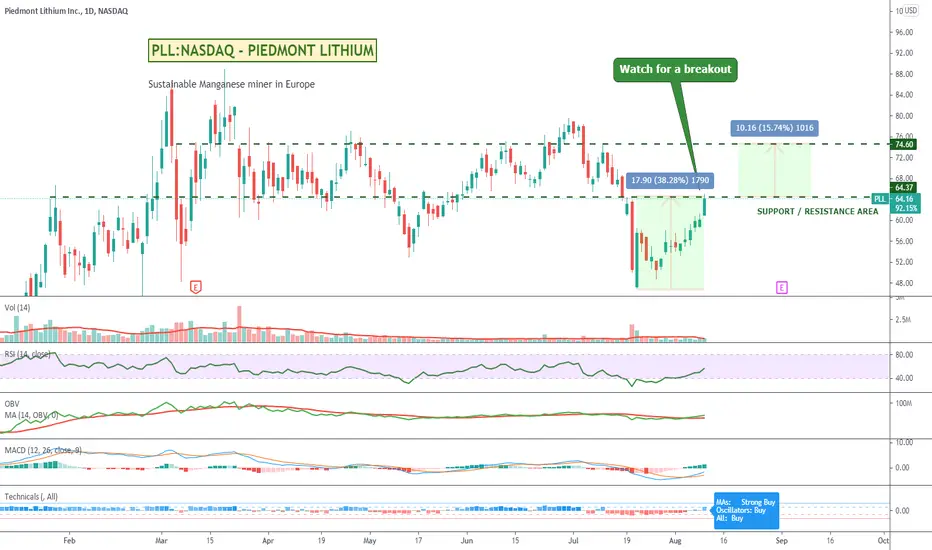
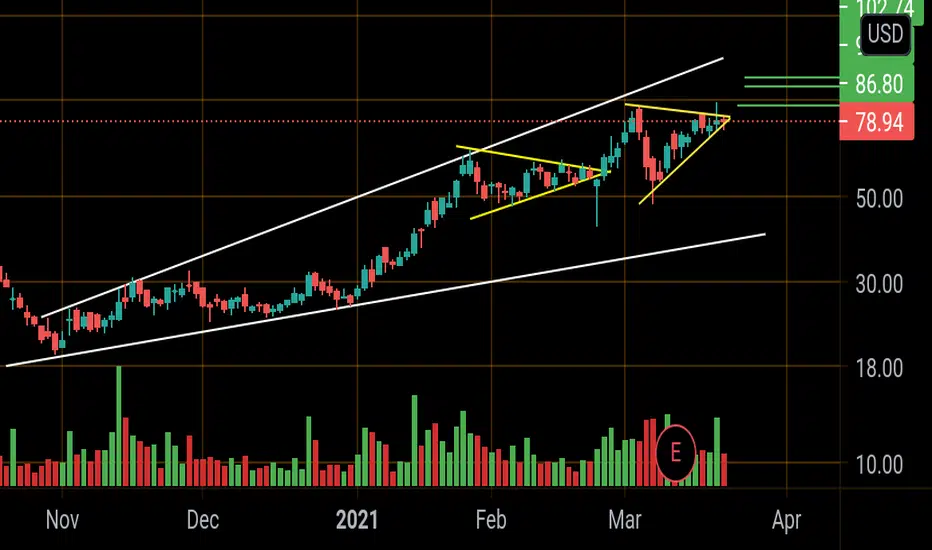
Falling Wedge- BullishAfter finally retracing, the lithium sector is starting to look ready to breakout with buyers starting to step in. Watching LAC & PLL closely here as both are holding massive falling wedges, however, PLL is seemingly forming an ascending triangle as well on its weekly timeframe (See Attached Chart Below). Additionally, PLL is holding the same falling wedge on the 4-Hour timeframe with its Bollinger bands squeezing, along with a Bullish Butterfly Harmonic Pattern, MACD golden cross. Bullish and will be looking for a breakout from this wedge (Broader Market Conditions Permitting)- Just some support and resistance levels to keep an eye on along with some RSI-based supply and demand zones in the meantime -- Price Targets & Previous Charts Attached In Description --
PT1- $56.12
PT2- $58.74
PT3- $60.07
PT4- $61.26+
--Weekly Timeframe--
--4-Hour Timeframe--

PLL - Inverse Head and Shoulders - WeeklyWatching LAC & PLL closely here as the lithium sector heads into earnings. PLL is seemingly holding the same channel after breaking out and retracing back to the channel it's currently holding. PLL is holding the same channel on the 4-Hour timeframe with its Bollinger bands squeezing, along with a Bullish Butterfly Harmonic Pattern, MACD golden cross. Bullish and and anticipating an upward move following their respective earnings reports. (Broader Market Conditions Permitting)- Just some support and resistance levels to keep an eye on along with some RSI-based supply and demand zones in the meantime -- Price Targets & Previous Charts Attached In Description --
PT1- $56.12
PT2- $58.74
PT3- $60.07
PT4- $61.26+
--Previously Charted--

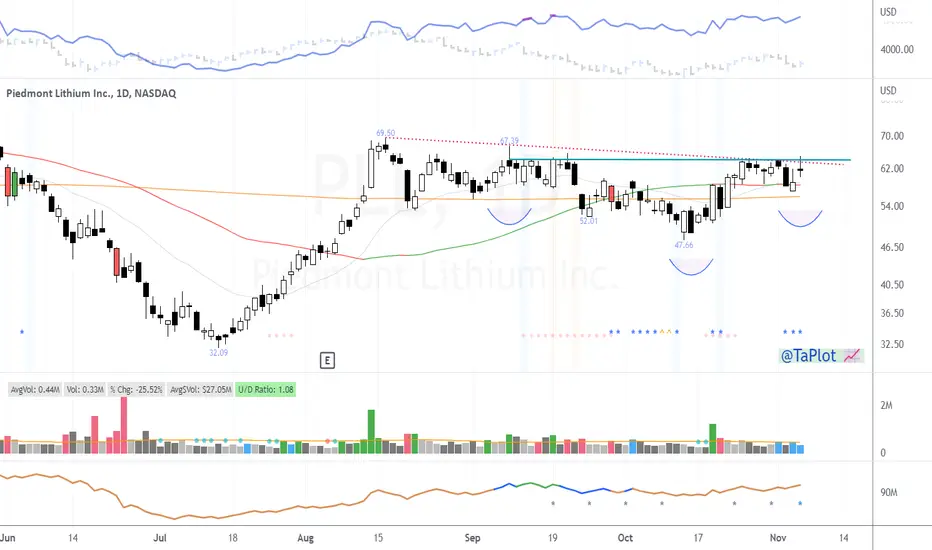
Piedmont Divergence UpdateHey Folks!
The fact that the current higher low, is disproportionately higher and is more over sold than the previous circled lows, and volume is at 60% of the 10-day, tells me that selling pressure is weakening and I should game plan an entry.
I am looking for bullish divergence to form within this current set of higher lows.
Meaning I want price to fall a little lower and I want to see the RSI establish a higher low.
Once RSI cracks above 50% I will consider the trade.
If my idea fails, then I expect low $50's.
Like i mentioned on my previous idea. There is way more liquidity to the downside, but this is a new and emerging market with big fundamental upside potential. If the NC permits do not get the stamp of approval, it will get ugly. For now it still seems to favor the upside imo.
Also, EV sector may start to heat up soon, lithium stocks will see some gains if so.
Hope this helps anyone!
Happy Trading!
OnePath

Piedmont Lithium continuation of Bullish DivergenceHey Folks!
This is an update to my Head and Shoulders bullish divergence idea.
You can see the double bottom Stochastic RSI and continued price increase. Granted it's not the most bullish divergence, but the H&S pattern at this moment, is more likely to play out than not imo. It's not unusual for price to stray only to come back into the fold in a H&S.
10 avg volume has increased slightly after today.
I don't pay much attention to analyst price forecasts, but in this case the targets are worth looking into and make technical sense to me. In fact I think they are modest.
I'm looking for a 100% return if Piedmont can get their mining permits approved by North Carolina. If approved, PLL would become one of North America's largest sources of lithium for electric vehicle batteries for Tesla and others.
This permit approval also adds an extra measure of risk to keep in mind. Also, there is a bearish case of a gap fill at $11.70 and there is a lot of liquidity in the mid 20's. I think this would be the result of a fundamental upset with the permit.
Price broke March 31 resistance at $60.94 and looks to be retesting that zone. I will update this idea accordingly.
Not financial advice.
Happy Trading!
OnePath

Piedmont Lithium: Inverse Head & ShoulderI found Bullish Divergence on the 1hr to support a move higher and maybe the H&S plays out.
Happy Trading!
OnePath

Stock Idea: $PLL (10 Feb 2023)$PLL
- Sector showing relative strength $AMLI $LAC
- Tightening up in a flag pattern, while surfing 10 DMA
- On weekly chart, stock has been building multi-month base

$PLL Head and Shoulders Continuation Setup$PLL lithium production industry with a head and shoulders trend continuation pattern.
Right shoulder 12% deep for a technical stop.
Worth watching.
$SGML been on fire in that group.
$PLL Setting UpLithium play setting up. potentially pyramid into this with small position over the high of this cheat area and add to it on new high grounds and potentially market improving.

PLL is a pump and dump trade!... and it's now in the "pump" phase!
The main competitors of Piedmont Lithium include U.S. Silica (SLCA), Energy Fuels (UUUU), 5E Advanced Materials (FEAM), Centrus Energy (LEU), Intrepid Potash (IPI), Compass Minerals International (CMP), Hecla Mining (HL), Denison Mines (DNN), Schnitzer Steel Industries (SCHN), and Orion Engineered Carbons (OEC).

$PLL looking goodMaybe I am jumping the gun with this one, but #PLL is shaping very well.
Constant bull pressure to pull the stock back from strong support around $0.67.
If it can only break the resistance this time.
20-30% play in short term. DYOR.
Disclosure: Hold


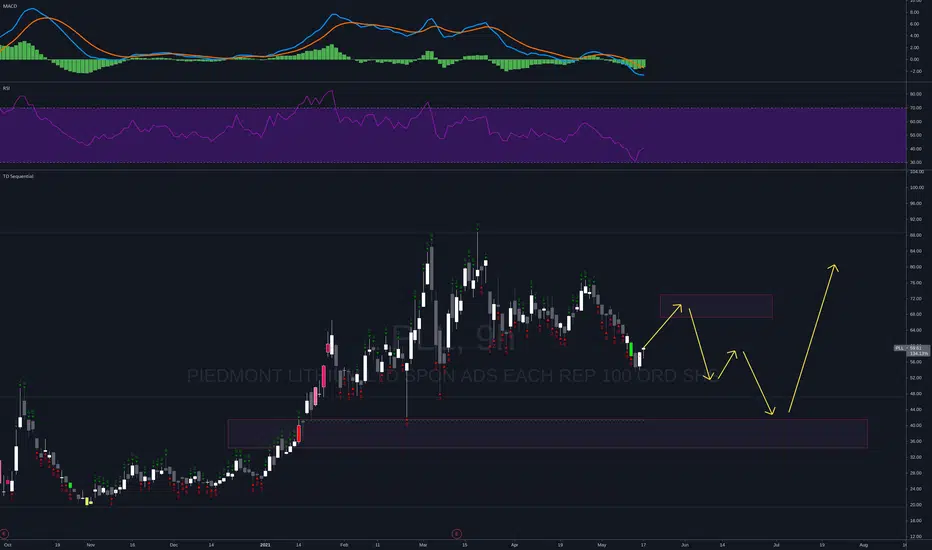
PLLAY Ball!Price is stuck in a rundown between 1st and 2nd. $55 may act as local support, spike up to target area, only to drop back down lower, where it'll find mucho support before blasting off.
PLL Might Be Good For A Quick WinDepends on your risk appetite, but PLL is up around 40% off a recent dip and if it breaks through the current area might have a bit more in it before earnings.
Watch your stops.
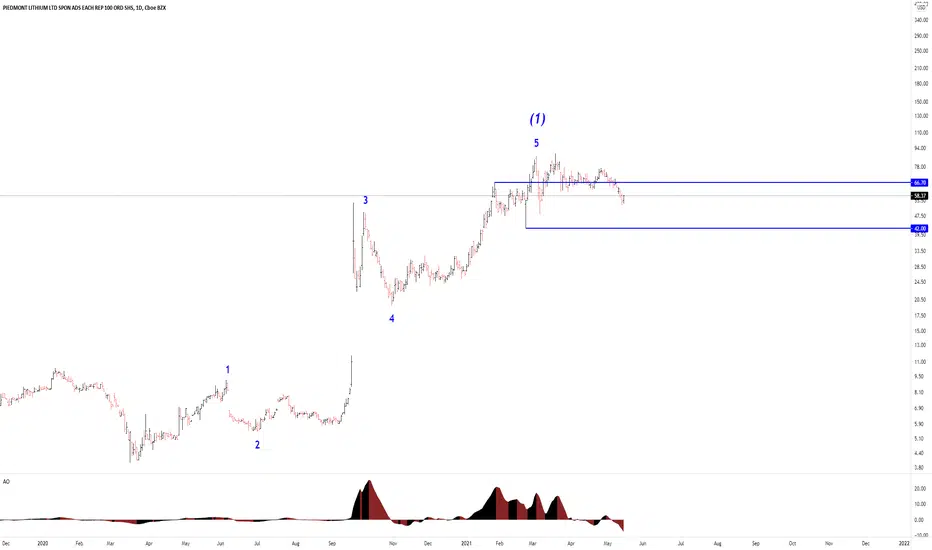
PLL breaks higher, new swing long?Last week PLL decisively broke above the recent resistance area of $75 - where the previous lower high was. On Friday, it printed a pinbar with possible setup for long on Tuesday when markets reopen. When looking at the broad structure out to weekly we can see clear bullish trend with possible wave 4 turning into wave 5 here. I like the potential to at least have a retest of that $85 area in the coming weeks, if not higher. The other thing I like about this stock is it's low correlation with the S&P and Nasdaq - suggest it may have a tendency to do it's own thing if there were a broader pullback across the markets.

$PLL bounced off of 618. I may enter after retrace$PLL looks like it's trending upward with good targets. I just bounced off the 618. Once it finds support or breaks the 618 I'll be entering for targets around $87 for 30 percent gain.

Accumulation before parabolic riseWorking on finding the low before a long sustained rise to new highs.
Piedmont broke uptrend, but bounced on daily 43EMAGood signs for piedmont lithium given the bounce, if i take the trendline out of it, id like to see PLL consolidate for a week around the 90-95c range before pushing higher again. Good stock in the right space with alot of volatility, and news from biden is setting the scene for lithium to have big growth this year.

Low risk entry for lithium value company PLLEntry here with stop at 43EMA on daily. 82c. Lithium is going to be a rened this year and i dont feel any medium to long trend line will get broken. But if it does, stop at 82c is only 10% downfall for 50% potential growth minimum.

PLL - A nice uptrend (100+ bagger in 5 months)Piedmont Lithium is an ASX listed rare earth stock that seems to be getting plenty of attention on a number of discussion forums and groups I follow - As such, I thought I'd perform some analysis.
Looking at the stock it's broken out extremely nicely from a long period of consolidation in September 2020 from a range of $0.060 - $0.150 to now around $1.120, making it a 100+ bagger if you got in in September 2020 (well done if you did).
The trend itself has been pretty choppy, particularly evident in October 2020 and March 2021 (both around earnings releases), however over the trend has been strongly up, with the 20 day MA providing fairly consistent support.
Looking at the trend structure, there seems to be fairly regular pullbacks over the last 5 months or so to the 20 day MA, particularly when there is a wide divergence between price and this MA. Based on this analysis the stock could be due for a pullback to around $0.940 mark before resuming the uptrend. If the price breaks below the 20 and heads towards the 50 MA, based on past history I would assume that the stock would consolidate again and this may be the time to exit.
Anyway that's my brief analysis, I hope you like it and if you do check out my blog www.nickthetraderguy.com

$PLL BreakOut Idea Related to the EV momentum growing $PLL Basing gorgeous hight tight flag base and waiting for breakout confirmation with big volume .
