PTM Platinum Asset Mgmt (ASX) Monthly 2Monthly chart has clear 5 wave move into longer term bullish fibonacci cluster level
This stock has taken a battering over the last few years and recently there is a monthly spinning top outside of the bollinger bands and a gap on the weekly at $1.05, so there is at least 25-30c to close this...
I'm looking at the longer term bullish bias, so wont be trading this as a short to medium term trade...
Full disclosure... I already have a position in this stock within the last month or so
PTM trade ideas

PTM Platinum Asset Mgmt (ASX) Monthly Long term butterfly pattern on the Monthly
Hit long term fibonacci cluster,
I've already bought this as a long term position

PTM (ASX) Platinum Asset ManagementLong term monthly chart
Eyeing this up as a long term multi year investment, not far off the buy zone in the next couple of months... I will be looking for signs of reversals on the lower timeframes for entry at or around the long term fib cluster level
Forward dividend should be decent and plan will be to sell half at 38.2% retracement from high to low which is a butterfly target
This may take years but it is a 400-450% gain from current levels...
Will post a follow up if I find a good entry point even though on this timeframe timing the market is less relevant... some shorter term habits die hard...

PTM Short after breaking out of multi year lowEntry: 2.49
Stop loss: 2.70
Shorted counter after it broke out of multi year low with high volume.
Better odds of a continued downside move as can be seen by the down trending MAs.

PTM.ASX_Breakdown Trade_ShortENTRY: 2.49
SL: 2.76
TP: 2.3
- ADX>20
- RSI<50,RSI>30
- Daily RS -ve
- Daily FFI -ve
- Daily MACD -ve
- Weekly RS -ve
- Weekly FFI -ve
- Weekly MACD +ve
- Breakdown of range today with good volume .
- Price below HVN currently.

PTM Point & Figure Price Target.Calculating price targets from a completed patterns (top or bottom) gives us an idea as to the extend of the move once it is underway. Here is another one of those for educational purposes only.
In this case, the the target is met and exceeded suggesting a potential re-test of the 2020 low(shown on the chart) over the coming weeks.
Chartist/Technical Analyst should now switch to their bar/candle charts for further insights to see if support is found again at that level if and when tested ?

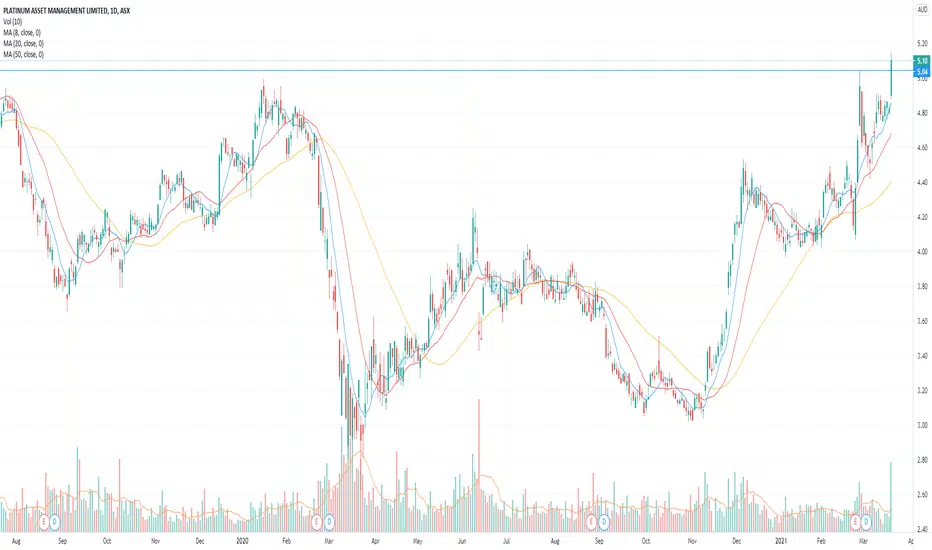
PTM.ASX_Breakout Trade_LongENTRY: 5.08
TP: 5.59-5.68
SL: 4.76
- ADX>25
- RSI>65
- RS and FFI +ve
- MACD +ve
- Breakout yesterday with good volume
- MAs aligned
- Weekly chart shows price set to close the week above 200MA

PTM Long after breaking out with high volumeEntry: 5.08
Stop loss: 4.72
Went long in the counter after it broke out of its base with high volume today.
Its 3 SMAs are in order.

PTM Platinum Asset Management ASX DailyLooking to buy the current retracement for a position trade long


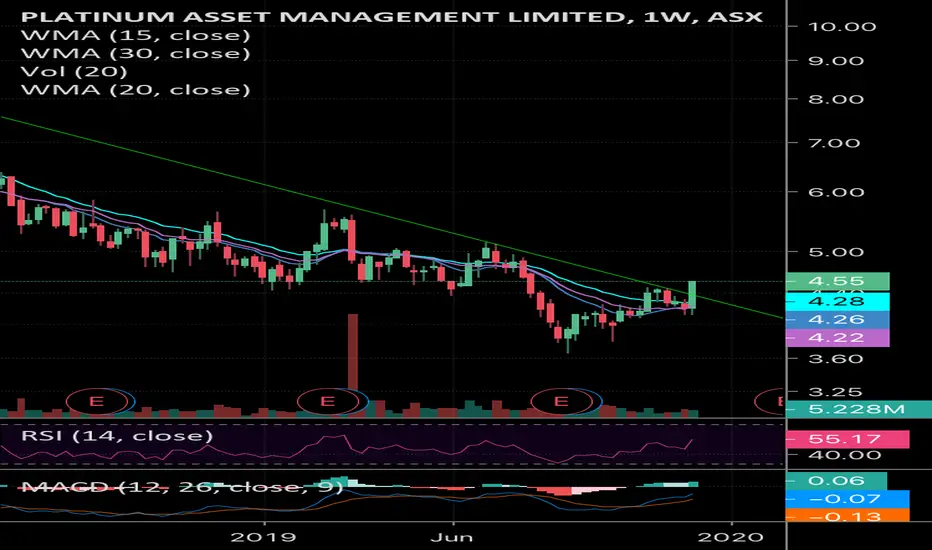
Platinum Asset Management ASX MonthlyCurrently sitting at a long term trend line
Looking to lower timeframes to buy for a long term position trade

Down she goes were it stops nobody knows...Down she goes were it stops nobody knows...
But $5.30 seems to be as good a spot as any. Question is how good is that Aug 2017 resistance level?
