SPY trade ideas

$SPY // June 10 2025 // Analysis & Targets for Day TradersWow!!! What a day!! This is the chart from premarket, and you can see that 35EMA catching us all day. The setup was there. Good Game!!

Late afternoon updateSPX is about as stretched as an ending diagonal should get. On Spy the pattern looks clear. If we are going to drop, it should be from this level. We'll see if that is correct soon enough.
USOIL found resistance at 66. Gold found resistance at 3350. Both need to get over their resistance to continue the uptrend. BTC pulled back and I think it goes lower. NG should go lower as well.

Nightly $SPY / $SPX Scenarios for June 10, 2025🔮 Nightly AMEX:SPY / SP:SPX Scenarios for June 10, 2025 🔮
🌍 Market-Moving News 🌍
📱 Apple Disappoints at WWDC Keynote
Apple ( NASDAQ:AAPL ) faced criticism after a lackluster WWDC keynote. Major AI and Siri upgrades were delayed, prompting a 1–1.5% drop in Apple shares—the weakest move during today's presentation
🎮 GameStop to Report Q1, Crypto Pivot in Focus
GameStop ( NYSE:GME ) is scheduled to announce Q1 earnings after market close. Investors will be watching for updates on its $500M Bitcoin allocation and potential crypto-related strategies
📈 Small-Business Optimism Rises
The NFIB Small Business Optimism Index for May came in at 95.9—above the 94.9 consensus—showing modest improvement in sentiment among small firms
📊 Key Data Releases & Events 📊
📅 Tuesday, June 10:
6:00 AM ET – NFIB Small Business Optimism (May):
A reading above expectations could boost risk market sentiment by showing stronger Main Street confidence.
⚠️ Disclaimer:
This is for educational/informational purposes only and does not constitute financial advice. Please consult a licensed professional before making investment decisions.
📌 #trading #stockmarket #economy #news #trendtao #charting #technicalanalysis

Are The Markets Running Out Of Steam? SPY just cant seemed to hold above the 600 psychological level.
Are big players unloading into this positive market strength?
Are we due for a larger pullback?
There's a lot of mixed price action and we just cant seem to make a true breakout.
Some names are underperforming and other names are outperforming.
We remain tactically bullish while trimming keys positions into strength.
Being nimble in this market us key as were seeing large intra day swings.
Short term there is some risk of lower price so we have hedged in some individual names while still remaining bullish.

Not much of an idea and probably gonna be wrong put predictionAt this point im just waffling but this is what im looking for (unlikely but my system sees a possibility)

SPY/QQQ Plan Your Trade For 6-9: Inside BreakawayToday's pattern suggests the SPY/QQQ will attempt to make a breakaway type of price move - away from Friday's open-close range.
Given the fairly tight opening price level this morning, I would stay cautious in early trading today and try to let the first 60 minutes play out - looking for that breakaway trend/momentum.
Overall, the markets are still in a Bullish price phase - trying to push higher.
But, as I continue to warn, I believe the markets could rollover and break downward at any time.
BTCUSD moved substantially higher overnight. This could be the beginning of a bigger advance higher. But, it could also be an exhaustion move higher.
Gold and Silver are still melting upward. This move in metals recently certainly shows the markets are still fearful of any potential downside price activity.
Again, I urge traders to stay cautious as we continue to struggle within the sideways price range.
Price will show us what it wants to do and I believe this move higher in BTCUSD could be a false type of breakout move to the upside.
Get some.
#trading #research #investing #tradingalgos #tradingsignals #cycles #fibonacci #elliotwave #modelingsystems #stocks #bitcoin #btcusd #cryptos #spy #gold #nq #investing #trading #spytrading #spymarket #tradingmarket #stockmarket #silver

Swing Trading OutlookThe Bulls are still in control but showing some weakness based on Friday's Doji. We are still above the 9SMA, so will continue to look for some short-term swing trades. Meanwhile keep an eye on the possible negative divergences forming. Cheers!

Weekly $SPY / $SPX Scenarios for June 9–13, 2025 🔮 Weekly AMEX:SPY / SP:SPX Scenarios for June 9–13, 2025 🔮
🌍 Market-Moving News 🌍
📱 Apple WWDC & Tech Momentum
Apple’s annual Worldwide Developers Conference kicks off Monday with CEO Tim Cook set to discuss new products, services, and likely AI initiatives—tracks should watch include impacts on NASDAQ:AAPL and AI-related stocks
🧨 GameStop Eyed for Crypto Pivot
GameStop (a meme-stock darling) reports earnings Tuesday. Markets are watching for updates on its $500M bitcoin investment and potential pivot toward crypto-driven revenue streams
🇨🇳 U.S.–China Trade Talks in London
High-level trade dialogue begins Monday between U.S. and Chinese representatives in London, offering possible relief to trade tensions and providing a lift to risk assets
📉 Key Inflation Data Midweek
Wednesday brings the May CPI release—crucial for assessing tariff-driven inflation trends and likely to influence Fed policy outlook ahead of next month’s meeting
💹 Oil Markets React to Trade Uncertainty
Oil prices are stable to slightly up ahead of trade talks, as Brent holds around $66/barrel—reflecting balanced supply concerns and hopes for easing global tensions
🌐 G7 Summit and Global Policy Risks
G7 finance ministers convene in Canada (50th anniversary), tackling trade strains, Russia–Ukraine, and inflation. Global macrospoilers could trigger renewed volatility
📊 Key Data Releases & Events 📊
📅 Monday, June 9
Apple WWDC begins (CEO keynote)
U.S.–China trade talks start in London
📅 Tuesday, June 10
GameStop Q2 earnings (+ bitcoin update)
NFIB Small Business Index (6:00 AM ET)
📅 Wednesday, June 11
8:30 AM ET – Consumer Price Index (May)
Watch for inflation signal from tariffs.
8:30 AM ET – Core CPI (May)
Core inflation trend under scrutiny.
📅 Thursday, June 12
8:30 AM ET – Producer Price Index (May)
Early check on wholesale inflation
8:30 AM ET – Initial & Continuing Jobless Claims
📅 Friday, June 13
10:00 AM ET – University of Michigan Consumer Sentiment (June, preliminary)
Consumer mood and tariff impact insights
⚠️ Disclaimer:
This is for informational/educational purposes only. Not financial advice. See a licensed advisor before making investing decisions.
📌 #trading #stockmarket #economy #news #trendtao #charting #technicalanalysis

SPY (S&P500 ETF) - Price Attempting Breakout Above ResistanceSPY (S&P500 ETF) price is attempting to breakout above Daily resistance levels of $594 and $597.
SPY ETF has been in an uptrend since May 2025. A Golden Cross also occured on May 19th 2025, signaling that a potential longer term bullish rally could occur.
Friday's candle closed as a Doji signaling some potential indecision after recent price volatility.
SPY price is not at any extreme level on the Daily chart.
If SPY price ever gaps up and rallies up to the $612 to $620 resistance zone, price could sell off stronger (short-term).
In June 2025, trade deal and inflation news will most likely be the catalyst for further volatility, in addition to government news announcements.

IS SPY & QQQ READY TO MAKE THE NEXT LEG HIGHER?In this video, I cover the weekly chart of AMEX:SPY and NASDAQ:QQQ to answer the question: are the markets getting ready to make their next leg higher and according to the charts on our weekly timeframe it seems to be the case... watch this video to find out more!

SPY Week of June 9thHey everyone,
Keeping this idea quick and focusing on the monthly levels as they have more going on.
Safe trades, remember not advice and take care!

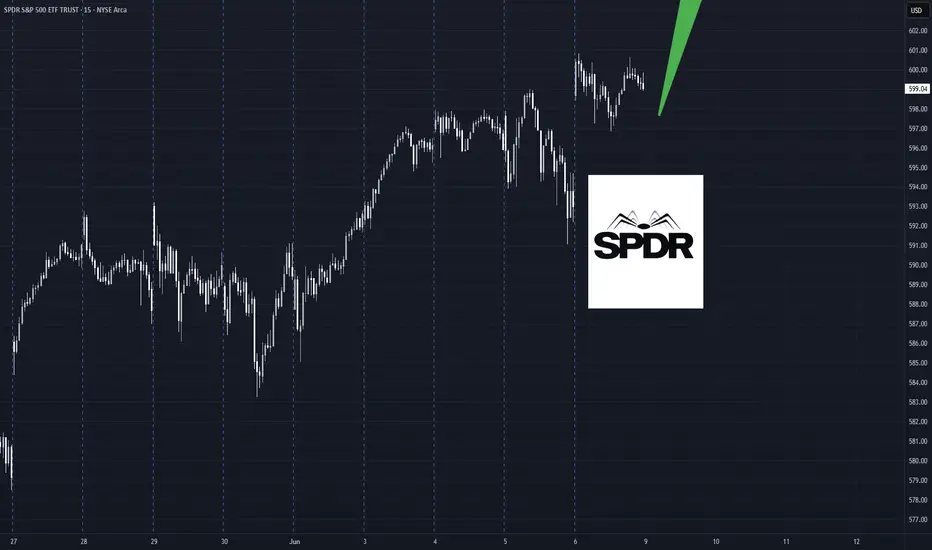
SPY Trading Opportunity! SELL!
My dear followers,
I analysed this chart on SPY and concluded the following:
The market is trading on 599.04 pivot level.
Bias - Bearish
Technical Indicators: Both Super Trend & Pivot HL indicate a highly probable Bearish continuation.
Target - 570.83
Safe Stop Loss - 616.43
About Used Indicators:
A super-trend indicator is plotted on either above or below the closing price to signal a buy or sell. The indicator changes color, based on whether or not you should be buying. If the super-trend indicator moves below the closing price, the indicator turns green, and it signals an entry point or points to buy.
Disclosure: I am part of Trade Nation's Influencer program and receive a monthly fee for using their TradingView charts in my analysis.
———————————
WISH YOU ALL LUCK


SPY Double Rising WedgeWatch the trendlines of both rising wedges and plan your trades accordingly. I will post the Monday Key trading levels in the next post

SPY CHANNEL JUNSPY ( AMEX:SPY ) – Multi-Timeframe Volatility Channel Analysis
SPY remains inside a well-defined ascending volatility channel across all key timeframes (2h, 4h, Daily, Weekly), confirming a strong bullish structure with clear institutional control.
🔸 Short-Term (2h – 4h):
Consolidating between 590 and 605, with recent rejection from upper bounds.
Multiple PUT positions triggered near 599 and 603, suggesting institutional hedging.
Key support: 590. Below that, watch for downside toward 586 or 576.
🔸 Mid-Term (Daily):
Bullish channel still intact.
As long as price holds above EMA20 at 585.77, the trend remains bullish.
Breakout above 608 opens targets toward 611 (gap) and then 617–620.
🔸 Long-Term (Weekly):
Weekly channel projects targets up to 635 if structure holds.
Strong institutional resistance zone between 607 and 611.

SnP forming right shoulderSupported by bullish indicators such as the Zweig Breadth Thrust and if May closes green, it means 1 year from now the market will have double digit returns every single time.

SPY JUNSPY – June Update
SPY continues to trade within a well-defined ascending channel, with bullish momentum intact.
Price is currently approaching a major resistance at 608, while holding above the key support at 590.
Immediate upside target: 608, followed by potential extension toward the gap fill near 611.
If price fails to hold above 590, downside pressure could lead to a retest of the gaps at 550 and 530, which act as major support zones.
As long as SPY remains above the channel midpoint and above EMA20 (585.77), the bullish structure remains valid.
#SPY #SP500 #Stocks #TechnicalAnalysis #OptionsFlow #Momentum #Support #Resistance
#globaltrade #investment #investing #stockmarket #wealth #realestate #markets #economy #finance #money #forex #trading #price #business #currency #blockchain #crypto #cryptocurrency #airdrop #btc #ethereum #ico #altcoin #cryptonews #Bitcoin #ipo

Overview of the Architectural Components within HFT SystemsArchitectural Components of HFT Systems
Designing an HFT trading system requires a holistic, ultra-low-latency architecture. Rather than a monolithic program, HFT systems are composed of multiple specialized components, each optimized for speed. A typical HFT software architecture can be broken into several layers or modules, including: Market Data Feed Handlers , Trading Signal/Strategy Engine , Order Routing and Execution Manager , Risk Management , and Exchange Connectivity/Gateway . These work in concert to achieve a full “tick-to-trade” pipeline from incoming data to decision to order placement.
Signal Acquisition (Market Data Handling)
Signal acquisition is the front end of any HFT system – it encompasses the intake of raw market data and extraction of usable trading signals from it. HFT firms typically subscribe to direct exchange data feeds for equities, futures, etc., rather than slower consolidated feeds, to get every quote and trade update as fast as possible. The module responsible for this is often called the Market Data Handler (MDH) or feed handler. Its job is to ingest and parse real-time tick data with minimal latency. This includes order book updates (bids, offers, cancels), trades, and other market events.
A feed handler must handle huge message rates. Major equity exchanges can generate hundreds of thousands of updates per second, and an HFT system may track dozens of instruments across multiple venues. The feed handler maintains an internal representation of the limit order book for each market, updating it with each tick. Efficiency in this component is paramount: processing each message should ideally take only a few nanoseconds to microseconds. To achieve this, HFT feed handlers use highly optimized data structures (often arrays or fixed-size buffers rather than tree/linked structures). They avoid dynamic memory allocation – memory is pre-allocated and reused to avoid garbage collection or
malloc/free overhead during trading.
The output of signal acquisition is a live, updated view of market state plus any derived signals. For example, the feed handler might also compute microstructural features on the fly: current top of book, depth imbalance, last trade price, etc., so that the strategy engine can quickly access these. In an HFT system design, this stage is often where most of the data bandwidth is handled. Everything downstream (trading logic, etc.) depends on the feed handler’s ability to keep up without lagging. If your feed handler falls behind (messages queueing up), your signals are stale – a fatal flaw in HFT. Thus, a guiding principle is to make this layer as bare-metal and streamlined as possible: use efficient languages (I personally use C++ for my algorithms), avoid unnecessary copying of data, batch process if possible, and leverage hardware accelerations. In practice, HFT developers profile their feed handling to the nanosecond level and sometimes even design custom memory layouts to ensure order book updates touch the CPU cache optimally.
Order Routing Logic and Smart Order Routers
Once the strategy decides to trade, the system needs to route orders to the appropriate trading venues. In a fragmented market environment (like U.S. equities with 16+ exchanges, or Europe’s multiple exchanges and dark pools), the logic of where and how to send an order can be complex. This is where the Order Manager and Smart Order Router (SOR) components come in . The order manager constructs orders and passes them to a routing algorithm that determines the best execution venue(s) based on factors like price, liquidity, and latency.
A Smart Order Router is essentially an algorithm that optimizes execution across multiple markets. For example, suppose an HFT strategy wants to buy 10000 shares of XYZ stock. Liquidity might be spread across BATS, NYSE, Nasdaq, IEX, etc. The SOR will observe the order books (via the market data module) and decide how to allocate the order: it might simultaneously send 200 shares to Nasdaq, 300 to BATS, 100 to NYSE, etc., to get the best overall price without tipping its hand too much on any single venue. It may also employ
tactics like order-splitting (slice the order into smaller chunks) or spraying many small orders across venues to hide the true size and reduce market impact. SORs can split aggressively or passively depending on the market data and are enhanced to cope with HFT by reducing latency and using smarter venue-selection algorithms. It's worth noting that the BATS exchange is the only exchange that pays takers of a price a commission fee while the rest of the exchanges pay makers for providing liquidity (Yes, HFT algorithms are paid a commission fee to trade while retail traders through there brokers will always pay outsized commission fees to trade).
Important considerations for order routing in HFT include:
Best Price and Liquidity : In the U.S., Regulation NMS requires routing to the venue with the best price (NBBO). SORs ensure if one exchange has the best offer, an outgoing buy order goes there (unless an exception like a dark pool midpoint is desired). Often HFT SORs will simultaneously access multiple venues to ensure they capture liquidity at the top prices before others do. The router must know in real time where the best prices are – hence tight integration with the live market data feed.
Speed vs. Cost Tradeoff : Some venues might have slightly slower access but lower fees or larger size available. The SOR often optimizes a cost function that balances execution speed, price, and fees. For example, an aggressive SOR might sweep all lit venues up to a certain price tolerance immediately (to minimize timing risk), whereas another might try a ping in a dark pool for price improvement if speed is slightly less critical.
Order Types and Venue Characteristics : Each exchange can have unique order types and behaviours (e.g., IEX has a 350µs speed delay; some venues offer midpoint peg orders; others have rebate vs fee). The SOR logic incorporates these. For instance, it might send an order to IEX only if it anticipates the speed bump won’t harm execution, or it might avoid venues where it predicts queue time would be too long. Venue parameters like average latency, fill probability, and fee are often configured so the router “knows” which markets are preferable.
Internalization and Dark Pools : Some HFT firms operate as market makers that also internalize flow or use dark pools. The SOR might include logic to check internal liquidity (e.g., see if an affiliate or internal crossing system has the opposite side) before going out. Or it might ping a dark pool if that could result in a non-marketable order finding a hidden match. This must be balanced against latency – dark pools can introduce slight delays.
Atomicity and Race Conditions : In fragmented markets, a risk is that by the time you reach the second or third venue, the price might have moved. SORs try to simultaneously hit all venues at once when doing a marketable order, to reduce this risk. There’s a notion of a “sweep” – sending orders in parallel such that you grab liquidity across venues within microseconds of each other. Some routers send immediate-or-cancel (IOC) orders to each venue at the same time. The complexity is handling the responses: some might fill, others partial, etc. The order manager then aggregates these fills and determines if more is needed or if it overshot.
From a technical implementation standpoint, the SOR and order manager operate under extreme time pressure in HFT. The time from a strategy’s trade decision to sending out orders must be minimal (often a few microseconds). This means the order routing logic is often implemented in the same process as the strategy to avoid inter-process latency, or even in hardware (some ultra-low latency routers are done on FPGA). The logic may be pre-compiled or use lookup tables to decide routing rather than complex computations in real-time. Some HFT firms also maintain connections to all exchanges simultaneously (via multiple network interface cards) so they can blast out orders concurrently. The architecture might have a thread per exchange gateway, all woken simultaneously to send messages when a signal to trade is given.
Crucially, risk controls are integrated in the order path. No matter how fast, an HFT system must check outgoing orders against limits (e.g., do not send an order that exceeds position limits or fat-finger bounds). These checks have to be extremely fast as well – often implemented as simple arithmetic comparisons in the order manager. Many exchanges also offer exchange-side risk checks and kill-switches now, but relying on those alone could be too slow or late.
In summary, the order routing logic in HFT serves to get the best execution possible across many venues, without sacrificing speed . A well-designed SOR can be a competitive advantage: if your router grabs liquidity 50 microseconds faster than a competitor’s, you avoid missing trades or chasing moving prices (the worst feeling).
Risk Controls and Safeguards
Despite the emphasis on speed and autonomy, HFT systems must enforce strict risk management at all times. The trading algorithms operate at such high speeds that a small bug or unchecked strategy can bankrupt a firm in seconds (notable incidents like the Knight Capital fiasco in 2012, where a faulty algo lost $440 million in 45 minutes). Therefore, robust risk controls are baked into the system architecture to prevent catastrophic errors and ensure compliance with regulations.
Key risk controls in HFT include:
Pre-Trade Risk Checks : Every order that an HFT system attempts to send is typically vetted against a set of limits before it goes out. These checks happen in the order manager or gateway component, and are designed to incur minimal latency (often just a few CPU instructions). Examples: Max Order Size (don’t send orders larger than X shares or contracts), Price Collar (e.g., if an order’s price is far outside the current market, block it – to avoid fat-finger mistakes like $0.01 asks when stock was just trading for $40 flash crash reference ), and Position Limits (don’t buy more than Y shares in total or more than Z in a single name). For HFT firms registered as market makers, regulatory obligations might also require certain limits (like not exceeding aggregate volume limits without alerts). These checks act as circuit-breakers for the algo’s behaviour.
Credit/Capital Limits : The system tracks its current usage of capital and ensures it doesn’t exceed set thresholds. For example, a running sum of gross and net exposure is updated with each fill. If the net long or short in any instrument exceeds a predefined limit, the system should halt further orders in that direction. Similarly, many firms have a daily loss limit – if cumulative P&L goes below a threshold, the system will cut off trading to prevent a death spiral. These are often hierarchical (per strategy limits, product limits, and firm-wide limits).
Kill Switches : A kill-switch is an emergency stop that can flatten positions and cancel all orders instantly if something goes wrong. This can be triggered automatically by the software (if it detects, say, an unusual burst of orders or loss), or manually by risk managers. Modern HFT platforms implement kill-switches at multiple levels – software, network (some use specialized network devices that can block outgoing traffic if a message with a kill command is sent), and via third-party services (exchanges themselves often have kill-switch APIs that brokers/HFTs can call to cancel all their orders on that exchange). The key is speed and reliability: a kill command should propagate faster than the algo can do harm. For perspective, after Knight Capital’s incident, U.S. regulators mandated broker-dealers (who often host HFT servers) to have risk controls including kill-switch functionality to prevent “errant algorithms” from disrupting markets.
Realtime Monitoring and Alerts : Although HFT is automated, most firms have a monitoring dashboard that shows key stats: positions, P&L, order rates, latency, systems health. If any metric goes out of bounds (e.g., order send rate spikes abnormally, or one strategy’s P&L suddenly plunges), the system can generate alerts or auto-disable that strategy. In some setups, separate shadow processes compute these metrics so as not to slow the main trading loop.
Exchange-Level Protections : HFT systems also take advantage of exchange-provided risk features. For example, many exchanges allow you to set fat-finger limits on their side, or provide cancel-on-disconnect (so if your server disconnects, all your orders are automatically canceled to avoid uncontrolled risk). Some markets have volatility guards – e.g., futures exchanges have stop logic if a trader executes a mass of trades that move price too far, the exchange might reject or halt trading. HFT firms configure these where possible. Additionally, HFT algorithms often incorporate logic to react to exchange trading halts or sudden illiquidity – if an exchange goes down or a symbol is halted, the system should freeze activity in related instruments.
Testing and Safeguards in Code : On the development side, HFT firms invest in simulation and testing frameworks to catch issues before deployment. Strategies are tested on historical data and in sandbox environments. Many firms also utilize a “guarded release” approach – initially running a new algo on small size limits and monitoring it closely. Self-calibration can also be seen as a risk measure: the algorithm might adjust its trading frequency or size down if it observes increasing slippage or error rates, thereby scaling back risk in volatile conditions.
Risk management in HFT must balance two opposing forces: safety vs. speed . Too many checks or overly conservative limits could slow down the system or reduce profits. However, not having adequate checks can be fatal. The best practice is to make checks as computationally cheap as possible and to set sensible thresholds that stop truly abnormal behaviour but do not interfere with normal operation. For example, a max order size of, say, 50,000 shares might never be hit during normal scalping activity, but would catch a wild runaway order. Or a per-second order rate limit might be set just above the typical peak – if the algo goes haywire and blasts orders 10x faster than normal, the limiter kicks in.
A concrete illustration of risk control importance: During the Flash Crash (2010) , some HFT firms’ algorithms exacerbated the crash by continuing to trade or suddenly withdrawing. In its aftermath, many firms implemented stronger guardrails such as “trading pause triggers” – if market volatility exceeds a certain threshold or if the market data feed becomes inconsistent (a known sign of trouble), their algos will automatically reduce activity or shut off . This ensures they don’t amplify a cascade. As another example, consider momentum ignition or other manipulative patterns – a relatively well-behaved HFT firm wants to avoid even accidentally doing something that looks like manipulation (their's a fine line between legal and illegal). So their algorithms might have logic like: “If we have layered 3 or more orders and none get filled, don’t keep layering” or “Avoid cancelling and flipping sides more than X times in Y seconds.” These are internal policies that also serve as risk/compliance controls.
In summary, risk controls are an integral architectural layer of HFT systems, often implemented as the Risk Manager module working closely with the order manager . They enforce trading limits, monitor exposure, and can intervene (or shut down trading) when predefined conditions trip. The ultimate goal is to trade another day – an HFT firm can’t afford a single day of uncontrolled trading that could wipe it out. As Hemang Dave on Linkedin put it in his HFT Architecture article : “While speed is important, robustness, risk management, and system reliability are equally critical. Over-optimizing without proper controls can lead to catastrophic losses.”.
Execution Logic and Fill Handling
The execution logic of an HFT algorithm governs how it actually places and manages orders to fulfill a desired trade. This is distinct from the high-level “strategy” decision (e.g., decide to go long 2000 shares) – execution logic is the tactical set of rules that achieve that position in the market, given the microstructure. In other words, it’s the layer that turns a trading intention into specific orders, and handles the outcomes (fills or lack thereof).
Key aspects of execution logic include:
Order Type Selection : Modern markets offer a variety of order types (limit, market, IOC, FOK, midpoint peg, discretion, etc.). HFT algos carefully choose order types that suit their needs. For passive market making, they’ll use limit orders, possibly with pegging (like pegging to midpoint or best bid with some offset) to systematically join the spread. For urgent liquidity, they might use IOC (Immediate-Or-Cancel) orders to avoid posting. Some HFT strategies exploit special order types – e.g., using hidden or iceberg orders if they want to conceal size, or using Add-liquidity-only orders to ensure they get maker rebates or queue priority. An algorithm’s execution module might have logic like: “If spread > X and volatility low, place a passive bid; if spread is tight or we urgently need to exit, send a market order (taker).” Also, certain venues have unique order types that HFTs leverage – e.g., Nasdaq’s Midpoint Peg, IEX’s D-Limit (pegged with protection), etc. Choosing when to use these is part of execution logic.
Order Placement and Cancellation Strategy : Execution logic often involves deciding the price level and timing for placing orders, as well as when to cancel or replace them. For example, a market making algo might place a buy limit order one tick below the best bid to improve queue position but not cross the spread. If it’s not filled within, say, 50 milliseconds, maybe it moves the order up or cancels if conditions changed. HFT execution often entails frequent order cancellations – in fact, high cancellation rates (often >90%) are normal as algos continuously adjust their quotes. A fill (execution) might trigger immediate subsequent actions: e.g., if a buy order got partially filled for 100 shares, the algo might cancel the remainder and reposition, or immediately place a sell order to take profit if it was a very short-term scalp. Execution logic is like an “inner control loop” that constantly reacts to feedback: fills, changes in market prices, etc.
Fill Handling and Bookkeeping : When an order (or part of it) executes, the system updates its internal state: position changes, cash balance, etc. The execution module ensures all these updates happen atomically and correctly – this is important for risk and for subsequent decisions. For instance, if an HFT strategy sent out 10 orders and 3 get filled, it needs to recognize that it now has that inventory and perhaps cancel the other 7 if they’re no longer needed.
Order Book Queue Management : Especially for passive execution, HFT cares about queue position. Execution logic might try to infer how far back in line its order is at a given price. This can be done by estimating how many shares are ahead (from order book data when the order was placed minus any intervening trades). Some algorithms will cancel and re-post if they suspect they are too far back to get a fill in time. For example, an algo might only want to sit in queue if it’s in the top 10% of the queue, otherwise it’s wasting opportunity and could instead try a different approach. This leads to behaviours like order layering and replacing – e.g., sending multiple small orders sequentially to hop closer to the front as other orders cancel, or canceling and re-submitting slightly revised orders to maintain priority. However, note that excessive cancel/replace can cross into “layering” if done with deceptive intent (illegal), so algos tune this carefully for legitimate purposes.
Trade Execution Algorithms (Execution Algos) : Within the HFT context, sometimes HFT firms implement their own mini execution algos akin to how brokers/traders use VWAP, TWAP, etc., but on a much faster scale. For instance, if an HFT strategy wants to acquire a large position, it might stealthily do so via a series of small orders to minimize impact – effectively an intra-second TWAP. Another scenario: in futures markets, if an HFT needs to roll over or unwind a position quickly without spooking the book, it may randomize its order size/timing a bit to appear less predictable. These are execution tactics that are part of the algorithm’s design. Some HFT systems separate the logic: the “decision engine” says what to do (buy X amount), and an “execution engine” module decides how to do it optimally (slice into N pieces, stagger them, etc.).
Smart Order Cancellation on External Events : Good execution logic is very responsive to context changes . For example, if an algo has a resting buy order and suddenly the market price starts dropping rapidly, it might be prudent to cancel that order to avoid catching a falling knife (unless the strategy explicitly wants to buy the dip). Or if news comes out or a related instrument moves sharply, the execution logic might adjust all working orders. HFT systems implement cancel-on-condition rules: if best bid/ask moves away from our order by more than X, cancel it; if our order is at risk of trading through (e.g., our buy is now above the new best ask due to a flicker), definitely cancel to avoid bad fills. These ensure the algo’s orders don’t get “hung” in dangerous positions.
Handling Partial Fills and Remainders : HFT algos rarely show their full hand if it’s sizeable – they tend to get filled in small chunks. The execution logic deals with the case where, say, you wanted 1000 units but only got 300 on the first attempt. It can then reassess: do we still want the remaining 700? If yes, what’s the next step – try again at the same price? move price? try another venue? Or sometimes a partial fill on one side triggers an action on the other side – e.g., a pairs trading strategy got half of its long leg filled, it might start filling the short leg proportionally to stay balanced.
In essence, the execution and fill logic is where the market microstructure knowledge is hard-coded. This part of the system embodies all the if-then rules and algorithms that a skilled trader might manually use, but at machine speed. It’s also the part that interacts directly with the exchange via the Exchange Gateway (the software that formats orders to exchange API). An HFT architecture’s components include an Order Manager linked to an Exchange Connection/Gateway , which together handle order placement and acknowledgments. The exchange gateway usually provides confirmation of order receipt
and reports fills back; the execution logic must handle these in real-time.
Notably, HFT execution often assumes non-blocking, asynchronous operation: the system can send dozens of orders without waiting for each fill confirm – it keeps track of outstanding orders via IDs. This means concurrency issues need to be handled (like two orders filling at once), and careful state management is required. Modern languages and libraries that allow lock-free programming (e.g., using atomic operations for counters) are often employed here to avoid any delays from thread synchronization when updating fills or positions.
Feedback Loops and Self-Calibration
High-frequency trading algorithms operate in a dynamic environment where market conditions can change in milliseconds. As such, effective HFT systems incorporate feedback loops and self-calibration mechanisms that allow them to adjust their parameters on the fly. This can be thought of as the HFT equivalent of control systems in engineering: the strategy monitors its own performance and the market’s response, and tunes itself for optimal performance or to avoid problems.
Some examples of feedback and self-correction in HFT algorithm design:
Adaptive Order Placement : An HFT strategy might start by posting at a certain rate or spread, but if it observes that its orders are not getting filled at the expected rate (perhaps because competition increased or volatility changed), it can adjust. For instance, a market maker algo might widen its quotes if it starts getting too many toxic fills (losing money on immediate adverse price moves), which indicates adverse selection. Conversely, if it’s not getting filled at all (perhaps being outcompeted), it might tighten quotes or increase size. This adaptation can occur on very short timescales – e.g., “if 100 successive order placements resulted in zero fills, maybe our price is off; adjust price or size by a small epsilon.”
Latency and Queue Position Feedback : As mentioned earlier, HFT algos estimate their queue position. They also measure how long it typically takes to get a fill at a given position. If an algo notices that every time it’s, say, 5th in line it almost never gets filled before the price moves away, it might incorporate that feedback to only post when it expects to be within the top 3. Some advanced strategies use learning algorithms to predict fill probabilities based on current order book state and recent history, and then adjust their posting behavioir accordingly (this borders on machine learning applied to microstructure).
Profit and Loss (P&L) Monitoring : An HFT strategy usually has real-time P&L computation. If the strategy’s P&L starts consistently trending negative under certain conditions, that’s a feedback signal. For example, maybe the strategy loses money in the lunchtime period when liquidity is thin – a self-calibrating approach would be to automatically scale down trading during those hours. Some HFT systems will dynamically turn off or on certain sub-strategies based on recent performance. This is akin to regime detection: the system figures out “the current market regime is one where my strategy doesn’t do well, so I’ll trade less aggressively until conditions improve.”
Parameter Tuning : Many strategies have parameters (thresholds, aggression levels, etc.). While these are often initially set via offline optimization, HFT systems can also tweak them in production. For instance, a statistical arbitrage strategy might have a parameter for how wide a divergence needs to be to trade. If it finds that signals are too sparse, it could lower the threshold to get more trades (but risking more noise). Alternatively, if it’s getting too many false signals (trades that revert to losses), it might tighten the threshold. Some firms use real-time analytics to estimate the short-term volatility or noise level and adjust strategy parameters accordingly – essentially implementing a volatility filter . For example, a pairs trading algo might widen its band during high volatility so it doesn’t trade on movements that are just random noise.
Reinforcement Learning Elements : A cutting-edge approach is to use reinforcement learning agents that continuously learn from market interaction. While full RL in live trading is still experimental, certain elements are used. For example, a market making algorithm can be framed as an RL problem where the agent observes state (order book, positions) and takes actions (place/ cancel orders) with the goal of maximizing profit minus inventory risk. Such an agent would inherently use feedback (rewards) to adjust its policy. Recent research indeed has applied deep reinforcement learning to high-frequency market making, training algorithms that adjust quoting strategies based on observed reward signals . In live deployment, one might not have the RL learn from scratch, but an algorithm could have multiple modes or sub-policies and learn which mode works best in the current market environment (explore/exploit on a meta-level).
Execution Feedback : Execution algos often measure slippage – the difference between expected execution price and actual. If slippage starts increasing, the algo might decide to be less aggressive or trade smaller clips. For instance, if an algo is breaking a large order into 500-share lots but sees that every lot is moving the price, it might drop to 200-share lots. This is a feedback loop using market impact observations to calibrate order size.
Systematic Self-Test : Some HFT systems periodically run heartbeat orders – tiny, non-risky orders – to gauge latency or market responsiveness. For example, sending a 1-lot order in a quiet instrument to confirm that the trading loop is functioning within normal latency. If the return trip (order send to acknowledgment) is slower than usual, perhaps there’s a system issue and the system might reduce trading until that’s resolved (this overlaps with system health monitoring, but it’s a feedback to the algorithm to possibly halt if infra is lagging).
Implementing feedback loops requires careful design to avoid oscillation or unintended consequences. You don’t want your strategy over-correcting (e.g., widening spreads a lot at the first loss and then missing out on profit opportunities). Typically, designers use smoothing or incremental adjustments and perhaps a floor/ceiling on parameters. The adjustments might also be asymmetric: if things are bad, cut risk quickly; if things improve, scale up slowly (an analogy to how traders might manage risk).
A good example of self-calibration in a real system is an adaptive market-making model that monitors realized volatility and order flow imbalance . If volatility spikes, the model widens quotes (less inventory, more spread). If order flow becomes one-sided (indicating a trend), the model might skew quotes or reduce size on the losing side to avoid getting run over. Once volatility normalizes, it narrows back. All of this can be automatic.
From an implementation perspective, these feedback computations run in parallel with trading. They might operate on aggregated data over seconds or minutes (which in HFT is a long horizon) and then feed new parameter values into the fast trading loop. In highly sophisticated outfits, a meta-algorithm could even temporarily turn off a strategy if it gauges that the strategy is performing significantly worse than expected in current conditions – like a circuit breaker on strategy performance.
In summary, feedback loops and self-calibration make HFT algorithms more robust and adaptive . Markets aren’t static, and an algo that was calibrated on last month’s conditions might falter today if nothing is adjusted. By incorporating real-time performance feedback, HFT systems keep themselves tuned close to the optimal operating point. It’s analogous to a high-performance engine with sensors and an ECU that adjusts timing and fuel mixture on the fly for maximal performance and safety. This adaptiveness is one reason HFT firms invest in not just speed, but smarter algorithms – the ability to learn and adjust faster than competitors can be even more important than raw speed in the long run.
Market Microstructure-Aware Design
Market microstructure – the fine-grained rules and mechanics of how orders interact in an exchange – plays a pivotal role in HFT algorithm design. A successful HFT algorithm is deeply microstructure-aware , meaning it exploits the specific workings of the trading venue: order priority rules, fee structures, available order types, tick sizes, etc.
Features that HFT algorithms leverage:
Order Priority (Price/Time Priority) : Most order matching engines give priority to the best price, and among orders at the same price, to the earliest order (first-in, first-out queue). HFT algos thus crave being at the front of the queue when they post limit orders. Queue position management is almost an art form in HFT. Strategies will carefully decide which price level to post at – if you post at the best bid, you join the back of the queue; if you improve by one tick, you become first in line at a new best bid (but now you’re crossing a tick and potentially giving up edge). HFTs often improve the quote by the minimal increment to get priority when they sense it’s safe to do so. Some strategies even rotate their orders: if they’ve been sitting and not getting filled (meaning they’re deep in queue and others are ahead getting filled), they might cancel and re-enter the order, effectively moving to the back but resetting the time (this would be counterproductive normally – you lose priority – but if you were so far back that chances of fill were near zero, resetting might not hurt, and could in fact place you ahead of other slow market participants who haven’t updated their orders). However, exchanges have made some rules to discourage frivolous queue resets (e.g., certain markets
penalize excessive order updates).
Maker-Taker Fees and Rebates : Many equity venues operate on a maker-taker model (liquidity adders get a rebate, takers pay a fee) or the inverse (taker-maker on some venues like BATS). HFT algos absolutely factor in these economics. A strategy might be willing to sell at a slightly lower price on an exchange that gives a high rebate because that rebate offsets the price difference. Or an arbitrage strategy might simultaneously post on multiple venues aiming to collect rebates while capturing a spread. Part of microstructure-aware design is routing orders in a way that maximizes net after-fee P&L. For example, if both NASDAQ and NYSE have the same price, an HFT might prefer the one with the better rebate for adding liquidity – but only if the latency and fill likelihood are comparable. Some sophisticated strategies also rebate arbitrage , where the goal is less about price difference and more about capturing the rebate by providing liquidity and then hedging on another venue.
Tick Size Constraints : Each market has a minimum price increment (tick). HFT algos often exploit tick dynamics. In a stock with a relatively large tick (say $0.01) and low price volatility, the inside quotes tend to stick at a level until a trade clears them out. HFT market makers in such stocks can earn the full spread (e.g., buy at $10.00, sell at $10.01) because the tick is wide relative to true value variation. Conversely, in futures or FX where ticks are finer, spreads can be one tick most of the time, so strategies might compete on speed to earn even a fraction of a tick. Queue dynamics are also tick-dependent: if tick size is large, being second in queue still guarantees the same price, so queue position is crucial. If tick size is extremely fine relative to volatility, you might see price flipping frequently by a tick, in which case being at the front is less important than reacting to price changes. HFT algos adapt to this – for instance, knowing whether to join an existing price level or to establish a new one depends on tick size and likelihood of price movement.
Order Types and Exchange-Specific Features : Exchanges offer various order types that HFT algos use to their advantage:
Midpoint Pegs : e.g., exchanges allow orders pegged to mid-price, which might get better fills if there’s hidden liquidity crossing at midpoint. HFTs providing midpoint liquidity might capture half the spread consistently, but they must predict when midpoint orders will execute (often against hidden or IOC liquidity).
Iceberg Orders : These display only a portion of their size. HFT can either use them (if they want to hide size) or detect others’ icebergs (for example, seeing the same price level refresh repeatedly after partial fills is a sign of an iceberg – HFT algos detect this and then may try to execute against it fully by repeatedly taking the displayed part until the iceberg is exhausted).
Discretionary and Conditional Orders : Some venues have order types that can automatically adjust (e.g., IEX’s D-Limit which pegs and can move with the CQI signal). HFT algos must understand these – both to use them and to anticipate their effect on the order book.
Market-on-Close, Opening Auction orders : HFT firms also play around auctions (opens/closes) – placing orders that participate in the opening or closing auction when that suits the strategy (especially if there’s an imbalance they detect from imbalance feeds). Auction dynamics are different (one large batch match), so algos might have separate logic for that.
Latency Arbitrage Considerations (Protected Quotes) : In the U.S., Reg NMS ensures that the best quotes are “protected” – you can’t trade through them. HFT algos exploit this by cross-market arbitrage : e.g., if they see Nasdaq about to update its price, they race to other exchanges to trade before those exchanges update their NBBO. The microstructure angle
is that the securities information processor (SIP), which publishes consolidated NBBO, is slower than direct feeds, giving an edge to those with direct feeds who can act before the NBBO officially moves. Many HFT strategies are built around direct-feed vs SIP delays, essentially microstructure quirks of how information disseminates. Some strategies also anticipate which venue’s quote will update next – e.g., if EDGX executes a big trade that clears out liquidity, it will drop from the NBBO, and HFT could quickly adjust quotes elsewhere in anticipation.
Exchange Latency and Queue Modeling : Each exchange might have slightly different matching engine latency and mechanics for queuing incoming orders. HFT firms empirically measure how long it takes to get a response from each venue and even how the matching engine processes batch arrivals (e.g., if multiple orders arrive in the same millisecond, does the exchange randomize them or queue by receive time?). Some markets (like certain dark pools or IEX with speed bump) intentionally randomize or delay, which HFT microstructure-aware algos account for – e.g., they know they can’t race someone on IEX due to the 350µs delay, so they adjust their arbitrage logic accordingly (maybe avoiding IEX in races, or using IEX only for certain order types like D-Peg that rely on their signal).
Market Structure Differences Across Asset Classes : HFT algorithms are tailored to the specifics of each market type. For instance, equity markets have lit order books and dark pools – HFTs may run strategies that ping dark pools (liquidity detection as discussed) and simultaneously manage lit quotes. Futures markets often have a single central limit order book per contract (no fragmentation like equities), but they have different fee structures and often different priority rules (e.g., CME uses price-time, Eurex uses price-pro rata for some products, etc.). An HFT algo on a pro-rata matching market (common in options or some futures) will use different tactics – e.g., posting larger size can get a proportional fill even if not first in line. So if the algorithm is trading such a product, it might post more size than it actually wants, expecting to cancel the remainder after partial fill (this can be tricky as it edges towards anti-gaming rules – exchanges monitor that too).
Adverse Selection Metrics : HFT firms often develop quantitative measures of adverse selection in each venue or for each order type. For example, how often does a posted order that gets filled end up being a loser (price moves against it right after)? They might find that passive fills on Venue A are more toxic than Venue B, perhaps because Venue A is where informed traders aggregate. Then the microstructure-aware move is to post on B more than A , and maybe use A more for aggressive orders only. This kind of venue analysis is a microstructure-informed allocation of trading.
In essence, market microstructure-aware design means knowing the game’s rules intimately and designing your playbook around them. HFT algorithms are engineered with the details of each target market in mind – nothing is generic. The code often has per-exchange constants and behaviour toggles. For example, an equity algo might have a table of “exchange characteristics” (rebate, latency, queue estimate model, etc.) that it references when deciding routing or quoting. It will exploit any deterministic rule to its advantage: e.g., if an exchange randomizes queue priority for orders arriving in the same time bucket (some dark pools
do), a strategy might try to always slightly stagger its multiple orders to avoid being in the same batch, thereby potentially getting better priority.
A case study of microstructure exploitation is how some HFTs handled dark pools pre-2014 : They realized many dark pools were crossing at midpoint without price-time priority – meaning if you send a ping of 100 shares and there’s a 10000 share order resting, you’d get a fill and the big order would shrink, but nobody sees that. HFTs would sequentially ping multiple dark pools with small orders, detect liquidity, then potentially trade more once found. When regulators began cracking down and dark pools changed rules (like minimum order sizes or ping frequency limits), those strategies had to change. This shows how microstructure is not static – exchanges tweak rules and HFT algos must adapt quickly.
To conclude, microstructure-aware design is the heart of HFT advantage . Speed is the muscle, but microstructure knowledge is the brain. Whether it’s managing queue position, choosing the perfect order type, arbitraging minute cross-venue rule differences, or leveraging each exchange’s unique features, HFT algorithms derive much of their edge from being designed with these microscopic details in mind . That is why many HFT firms actively participate in exchange advisory committees or read every new rule filing – a tiny
rule change (say a new pegged order type, or a new matching engine update) can obsolete some strategies or enable new ones. The algorithms must continually evolve alongside the market’s microstructure.

BREAKING $SPY Ultra Rare Not seen since 2023 Holy GrailBREAKING AMEX:SPY Ultra Rare Not seen since 2023 Holy Grail
Inside week has broken out given last week!
I loaded in 45 contracts up 6 figures call me crazy but I want 7
All will be alerted here NO charge Low risk setups only
All I ask is drop a 👍

Stock Market Forecast | TSLA NVDA AAPL AMZN META MSFTStock Market Forecast | CME_MINI:NQ1! CME_MINI:ES1! QQQ AMEX:SPY
Mag 7 Forecast | NASDAQ:TSLA NASDAQ:NVDA AAPL AMZN META MSFT GOOG

SPY Swing Trade Plan – 2025-06-06📈 SPY Swing Trade Plan – 2025-06-06
Bias: Moderately Bullish
Timeframe: 3–4 weeks
Catalysts: Strong institutional flows, trade talk optimism, solid jobs report
Trade Type: Long equity position
🧠 Model Summary Table
Model Bias Entry Stop Loss Take Profit Holding Period Confidence
DS Moderately Bullish $600.02 $595.54 $618.02 3 weeks 65%
LM Moderately Bullish $598.50 $586.70 $616–618 3–4 weeks 75%
GK Strongly Bullish $600.02 $592.00 $610.00 4 weeks 72%
GM Moderately Bullish ~$600.50 $587.50 $627.50 3–4 weeks 70%
CD Moderately Bullish $600–600.50 $585.00 $620 / $635 3–4 weeks 72%
✅ Consensus: SPY is in a bullish trend across timeframes
⚠️ Disagreements: MACD momentum and entry/pullback levels
🔍 Technical & Sentiment Summary
Trend: SPY above 10/50/200 EMAs on all models
RSI: 60–61 → bullish but not overbought
MACD: Mostly positive, DS cautious on daily histogram
Support Levels: $591.06, $595.54, $597.26
Resistance Zones: $600.83, $605.21, $610
VIX: 17.6 (declining), supports risk-on sentiment
News: Trade talk optimism and strong jobs data fueling momentum
✅ Final Trade Setup
Parameter Value
Instrument SPY
Strategy LONG
Entry Price $600.00
Stop Loss $588.00
Take Profit $625.00
Position Size 83 shares (1% risk on $100K)
Entry Timing At market open
Confidence 70%
💡 Rationale: Aligned bullish signals across timeframes, falling VIX, and strong macro sentiment favor a trend continuation move toward $625. Position sized for conservative risk management.
⚠️ Key Risks & Considerations
MACD divergence could signal near-term stall
Resistance zone at $605 may act as a cap
Macro volatility: Strong jobs could raise rate expectations
VIX Watch: A spike above 20 could reverse market trend
Exit Protocol: Consider closing if SPY closes below the 10-day EMA (~$591)
📊 TRADE DETAILS SNAPSHOT
🎯 Instrument: SPY
📈 Direction: LONG
💰 Entry Price: 600.0
🛑 Stop Loss: 588.0
🎯 Take Profit: 625.0
📊 Size: 83 shares
💪 Confidence: 70%
⏰ Entry Timing: Open
S&P 500 in EUR - SHORT- in 15 days timeline
- broke the trendline that comes from 2020 to the downside
- retested and could not go above
- may try again and if fails again, then 25% correction likely
