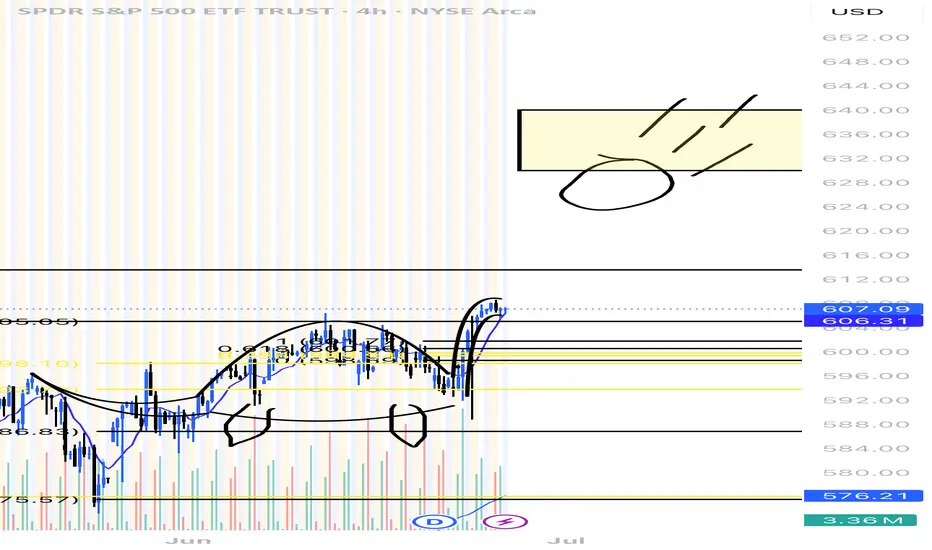
Dinosaur gets hit by a meteor We can see a clear breakout from previous lows only target left is that meteor at 630-640.
We will see this by the end of july!
SPY trade ideas
SPY "SP500 ETF" 1️⃣ Market Structure Overview
Change of Character (CHoCH) – Level: 626.19
The market printed a clear CHoCH at 626.19, breaking below a recent higher low. This shift signals the end of bullish dominance and marks the first warning of potential trend reversal. It’s a critical structure break indicating weakness in prior buy-side momentum.
Break of Structure (BOS) – Level: 631.54
A firm Break of Structure followed at 631.54, confirming the downtrend. This BOS came after price failed to establish a new high and instead reversed from the premium area, solidifying bearish continuation. It now acts as a key upper boundary for sellers.
2️⃣ Demand Zone Analysis (Support Levels)
The demand zones (green areas) are historical locations where price previously reacted strongly to the upside—suggesting institutional buying or significant liquidity absorption. These zones act as potential long-entry areas and support during pullbacks:
625.50: Immediate demand zone; price has hovered above this level recently, signaling short-term support.
624.80: Strong base formed after earlier accumulation; minor rally originated here.
623.80: Clear area of bullish imbalance; look for wick rejections here.
622.75 & 621.90: Deeper demand zones—likely to hold if the market retraces further and volatility spikes. These levels represent high-probability reversal points if liquidity sweep occurs below 624.
Each zone increases in risk/reward the deeper price pulls back, but also carries a higher chance of forming strong bullish reaction.
3️⃣ Supply Zone Analysis (Resistance Levels)
The supply zone (red area) at 628.85–631.54 was the origin of the last sharp bearish move following the BOS. It now acts as a potential reversal or distribution zone:
628.85 – 631.54:
This area previously held heavy sell-side interest and rejected bullish advances. It overlaps with a structural BOS and sits near the high of the prior rally. Watch for bearish price action or lower-timeframe exhaustion here. A break and close above 631.54 would invalidate this zone and indicate a major structural reclaim.
4️⃣ Current Price Action (Inside the Marked Border)
Price is currently reacting around 627, just above the CHoCH level (626.19). This zone lies between the upper boundary of the nearby demand and the lower edge of the supply. Within this boxed region:
Price is showing temporary consolidation, suggesting indecision.
A short-term dip into the 625.50–624.80 demand cluster is expected before any bullish leg.
If price holds above 626.19 and shows reversal signals (like bullish engulfing, hammer, or low-volume rejection), we may see continuation to test the 628.85–631.54 supply zone.
If structure fails and price breaks below 626.19 with conviction, the next downside targets are deeper into the 622–624 range.
This bordered zone represents a transitional area where the next directional move will likely be decided.
5️⃣ Momentum & Structure Bias
Structure remains bearish after the BOS, but current price is attempting to build a base.
If price maintains above CHoCH (626.19) and demand levels begin to hold, we may enter a bullish corrective phase.
Watch for rising volume on bullish candles or absorption wicks in demand zones as confirmation.
6️⃣ Macro/Fundamental Context (as of July 22, 2025)
While the chart is technical, the SPY ETF (S&P 500) is influenced by broader economic data. Around this date, watch for:
Earnings Season: Mid to late July often brings earnings from major S&P 500 companies. Positive tech earnings can fuel bullish momentum.
FOMC Speculation: If investors expect no rate hike or a dovish Federal Reserve stance, demand zones are more likely to hold.
Economic Reports: Look out for PMI or consumer confidence reports this week. A weak reading may drive SPY lower into demand, while a strong reading could help push it toward the supply zone.
If any bullish macro surprise occurs this week, it would support the bounce from the demand zone.

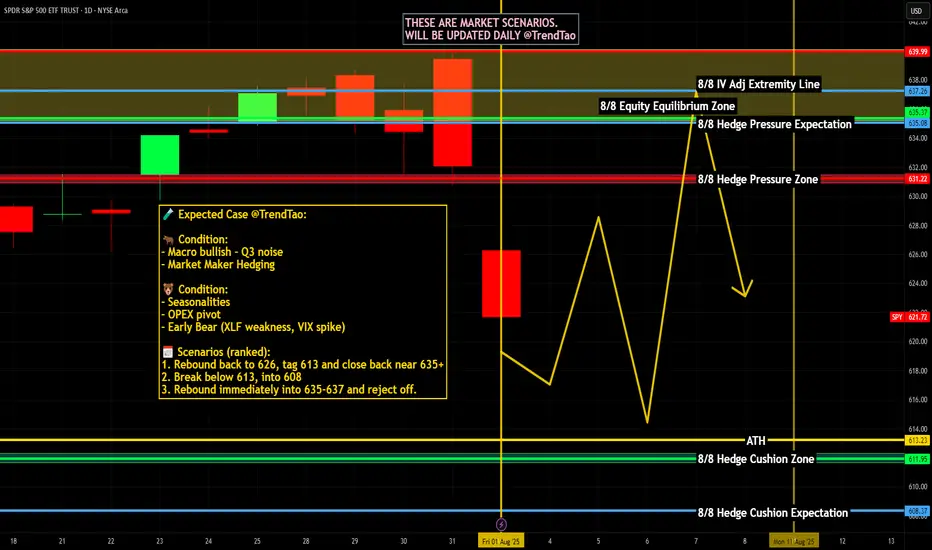
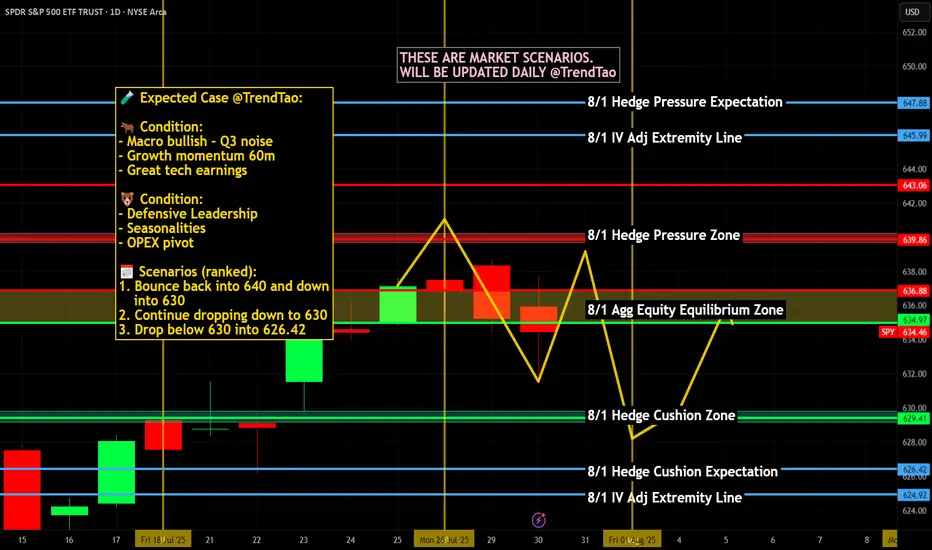
Weekly $SPY / $SPX Scenarios for August 4–8, 2025🔮 Weekly AMEX:SPY / SP:SPX Scenarios for August 4–8, 2025 🔮
🌍 Market-Moving News 🌍
📦 U.S. Tariffs Finalized as August 7 Deadline Nears
President Trump’s administration confirmed newly finalized tariff rates—ranging from 10% to over 40%—on dozens of countries, set to take effect starting August 7. The announcement has heightened global trade uncertainty and injected volatility into equity markets
📉 Weak Jobs Data Spurs Concern
July’s nonfarm payrolls came in at just 73,000 jobs added, far below expectations, while revisions to May and June data subtracted a combined 258,000 jobs. In response, the administration fired the Bureau of Labor Statistics head, escalating political risk around economic transparency
📈 U.S. Shows Resilience Amid Policy Chaos
Despite the tariff-era turbulence and labor softness, U.S. Q2 GDP rose by 3%—outperforming forecasts. Businesses racked up inventory as a hedge, absorbing initial price shocks. Still, concerns about sustained inflation pressures and waning consumer confidence linger
🎯 Earnings Week Spotlight on Tech & Industrial Names
Major companies reporting include Palantir (Monday), AMD, Uber, Disney, McDonald’s, Gilead, Pfizer, Constellation Energy, and Eli Lilly. Markets will watch for AI signals, consumer demand, and industrial trends
📊 Key Data Releases & Events 📊
📅 Monday, August 4
Factory Orders (June) — Critical for industrial demand and trade momentum.
📅 Tuesday, August 5
ISM U.S. Services PMI (July) — Thermometer for expansion in the biggest part of the economy.
S&P U.S. Services PMI (July, flash) — Preliminary signal on service-sector strength.
Trade Balance (June) — Watching for impact of tariffs and shifting cross-border flows.
📅 Thursday, August 7
Initial & Continuing Jobless Claims — Weekly labor-market readings post weak payroll report.
Productivity & Labor Costs (Q2) — Reflect business efficiency and wage trend shifts.
Wholesale Inventories (June) — Key for supply-chain and inventory cycle insights.
Consumer Credit (June) — Measures household borrowing resilience.
📅 Friday, August 8
Fed Speech: St. Louis Fed President Musalem — Market-watchers will look for cues on the near-term rate path.
⚠️ Disclaimer:
This weekly outlook is for educational and informational purposes only and should not be construed as financial advice. Always consult a licensed financial advisor before making investment decisions.
📌 #trading #stockmarket #economy #tariffs #jobs #earnings #inflation #Fed #technicalanalysis
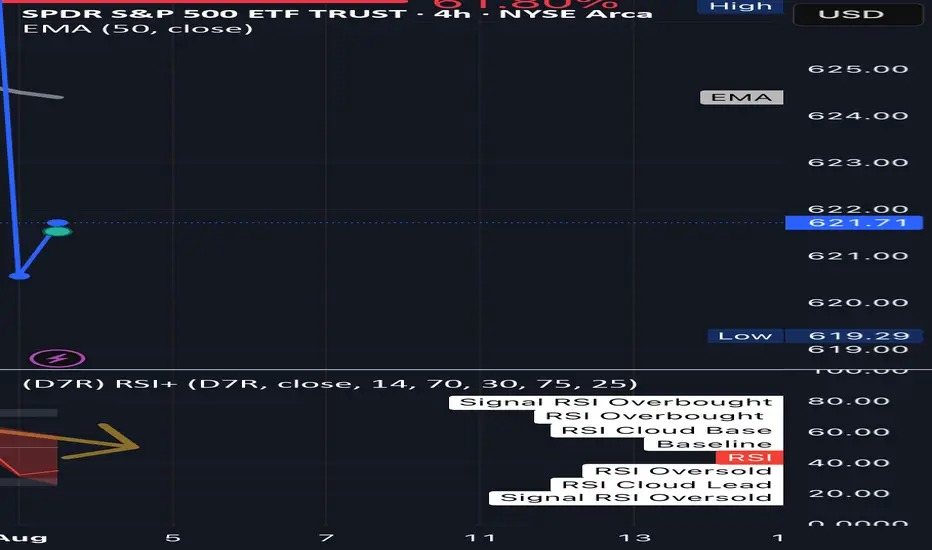
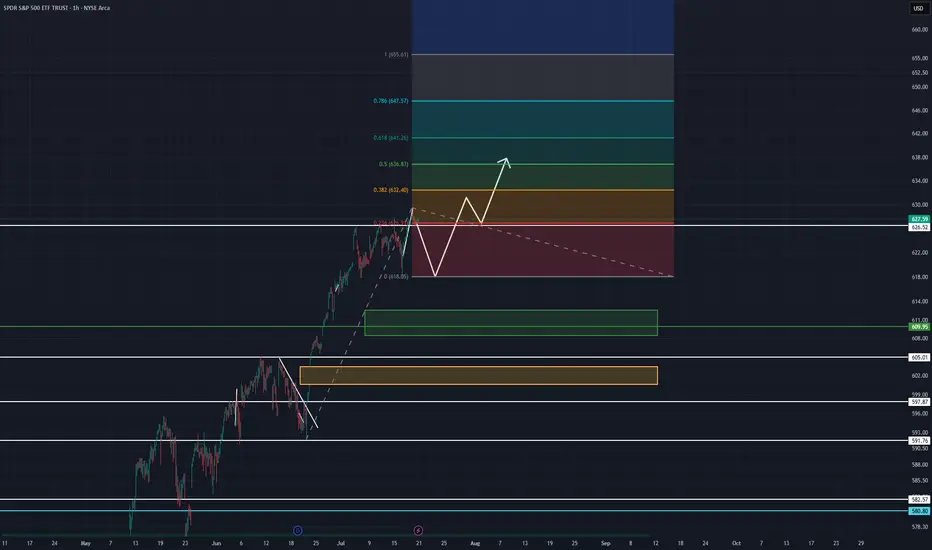
SPY 4H – Broke the Fib… Now What? Just Sharing What I See Hey People,
not an expert, just showing what i’m seeing on the 4H chart 👇
🧭 quick breakdown:
SPY ran up to around 639, then started dumping.
i dropped a fib from top to bottom and it hit the 61.8% level (626.66)… then lost it.
right now we’re sitting around 621, so it already broke a big level.
🧠 what that might mean:
if price gets back above 626, maybe we bounce back toward **629**
if not, and it keeps chilling under that **50 EMA (around 624)**, it’s probably still weak
nothing confirmed yet, i’m just watching how price moves around those spots.
⚠️ RSi is sketchy too:
rsi is making lower highs, even when price was up; that’s called bearish divergence
basically means momentum isn’t really behind the move
📉 If it keeps dropping:
if we lose 621, next support might be around **615**
and if that breaks? maybe even **610 gets swept** before any bounce
📝 Just how i’m seeing it rn:
not calling anything, just building my plan out loud
Still learning. open to feedback if you see something different
what levels are you watching?
I want everyone to win. 💛
SPY: Growth & Bullish Forecast
The price of SPY will most likely increase soon enough, due to the demand beginning to exceed supply which we can see by looking at the chart of the pair.
Disclosure: I am part of Trade Nation's Influencer program and receive a monthly fee for using their TradingView charts in my analysis.
❤️ Please, support our work with like & comment! ❤️

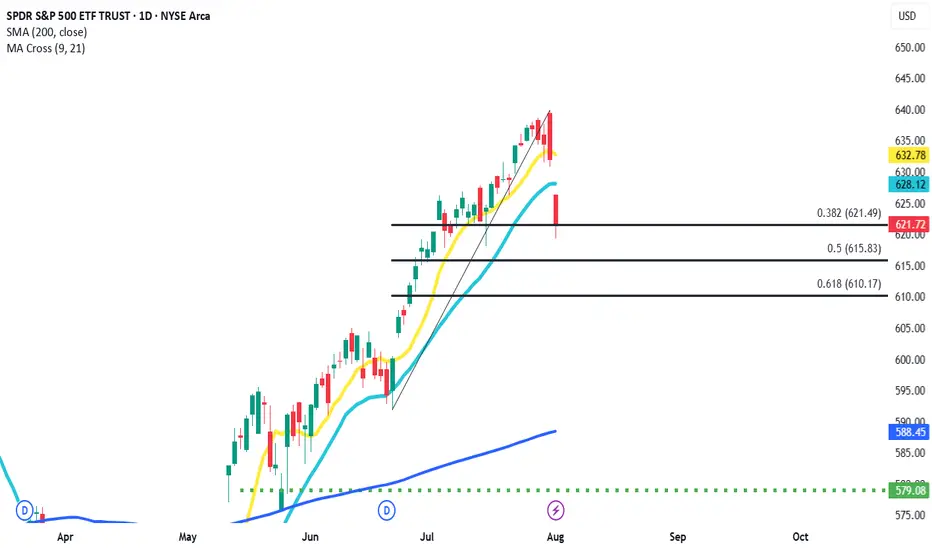
SPY bears finally show up. Here are my targetsLong term charts still look perfectly fine, and I'm not interested in fighting bears on the first day they show up in months. Here are the targets I'm looking at to find potential support

FIBO touch and goPretty violent last couple of days in July, but I honestly think it might be over for now. Price action couldn't break past .38 fibo retracement. If I'm right we could see continuation of uptrend in coming weeks.
Nightly $SPY / $SPX Scenarios for July 31, 2025🔮 Nightly AMEX:SPY / SP:SPX Scenarios for July 31, 2025 🔮
🌍 Market-Moving News 🌍
🏦 Fed Holds Rates — Dissent Indicates Division
The Federal Reserve maintained its benchmark rate at 4.25%–4.50%. Notably, two governors—Christopher Waller and Michelle Bowman—dissented in favor of a 25 bp rate cut, underscoring internal divisions amid growing political pressure
📈 Strong Q2 Growth, But No Rate-Cut Signal
U.S. GDP expanded at a 3.0% annualized rate in Q2, rebounding sharply from Q1's contraction. Despite this, Powell emphasized persistent inflation, particularly from tariffs, reinforcing the Fed’s cautious policy stance
🛢️ Oil Climbs as Tariff Tensions Rise
Brent crude rose to ~$73.51 and WTI to ~$70.37 on fears of supply disruptions tied to President Trump’s threats of new tariffs on Russian oil and new tariffs imposed on Brazil and South Korea
📊 Key Data Releases & Events 📊
📅 Thursday, July 31:
8:30 AM ET – Initial Jobless Claims (week ending July 26)
Initial claims rose to 222,000, up from 217,000 previously—an early gauge of labor-market trends
8:30 AM ET – Employment Cost Index (Q2)
Quarterly growth in labor costs edged lower to 0.8%, down from 0.9%—a signal of moderate wage pressures
8:30 AM ET – Personal Income (June)
Data released on household income and spending patterns—crucial for assessing consumer resilience heading into Q3
⚠️ Disclaimer:
This information is for educational and informational purposes only and should not be construed as financial advice. Always consult a licensed financial advisor before making investment decisions.
📌 #trading #stockmarket #economy #Fed #inflation #jobs #technicalanalysis
Market Outlook: Bulls are still in control, but be defensive.At theses levels don't let your guard down. I could see us pulling back next week, meanwhile we may continue to stay above the 10-EMA for now.

SPY: Aiming 626 today Slowly./ Let's observe what this market will give us. If there is a setup, we take the trade.

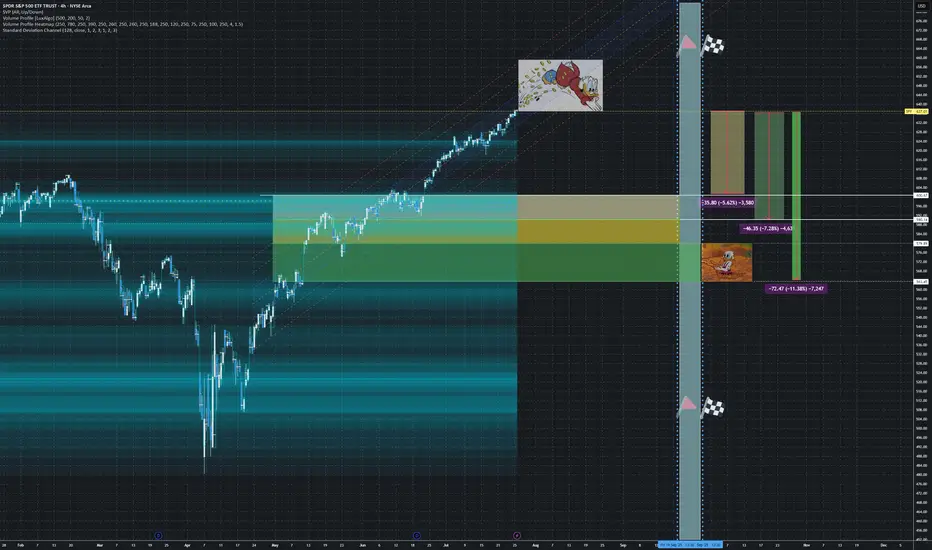
[$SPY] S&P500: The Big mini Short or Why hedging is not a crimeAMEX:SPY CBOE:XSP
No financial advice.
For Entertainment purpose only.
Have you ever considered to protect yourself and wake up from the 'Long-Only-Delirium'?
Now is the time.. do you hear the cracking in the bond-market?
Rate cutting will solve it?
No reason to panic?
Doomsday i*diot?
We will see... 😈 tic tac tic tac
This time THETA is against us, but GAMMA is bleeding.
📊 Strategy Characteristics
+++Note: We set this one as a 'Diagonal Ratio Put Spread'
> Diagonal: Because the options have different expiration dates (Sept 19 + Sept 30)
> Ratio: Because we are buying more puts than selling (4:2 ratio)
> Put Spread: Because both legs are puts with the same strike
"We are all at a wonderful ball where the champagne sparkles in every glass and soft laughter falls upon the summer air. We know, by the rules, that at some moment, the Black Horseman will come shattering through the great terrace doors, wreaking vengeance and scattering the survivors. Those who leave early are saved, but the ball is so splendid no one wants to leave while there is still time, so that everyone keeps asking, ‘What time is it? What time is it?’ But none of the clocks have any hands." ~George Goodman

[$SPY] S&P500: The Big mini Short or Why hedging is not a crimeAMEX:SPY
No financial advice.
For Entertainment purpose only.
Have you ever considered to protect yourself and wake up from the 'Long-Only-Delirium'?
Now is the time.. do you hear the cracking in the bond-market?
Rate cutting will solve it?
No reason to panic?
Doomsday i*diot?
We will see... 😈 tic tac tic tac
This time THETA is against us, but GAMMA is bleeding.
"We are all at a wonderful ball where the champagne sparkles in every glass and soft laughter falls upon the summer air. We know, by the rules, that at some moment, the Black Horseman will come shattering through the great terrace doors, wreaking vengeance and scattering the survivors. Those who leave early are saved, but the ball is so splendid no one wants to leave while there is still time, so that everyone keeps asking, ‘What time is it? What time is it?’ But none of the clocks have any hands." ~George Goodman
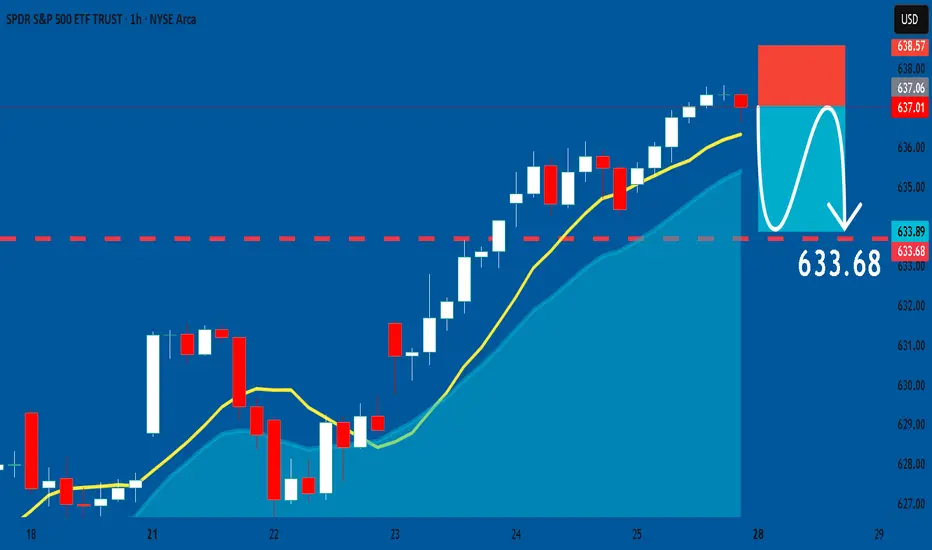
SPY: Bearish Continuation & Short Signal
SPY
- Classic bearish setup
- Our team expects bearish continuation
SUGGESTED TRADE:
Swing Trade
Short SPY
Entry Point - 637.01
Stop Loss - 638.57
Take Profit - 633.58
Our Risk - 1%
Start protection of your profits from lower levels
Disclosure: I am part of Trade Nation's Influencer program and receive a monthly fee for using their TradingView charts in my analysis.
❤️ Please, support our work with like & comment! ❤️
SPY Options Analysis Summary (2025-07-22)
🔻 AMEX:SPY Weak Bearish Put Setup (0DTE) – 07/22/25
All models agree: price is weak, momentum is limp, and VWAP is above.
But conviction? Not unanimous. High-risk, high-reward 0DTE scalpers only.
⸻
📉 Trade Setup
• 🟥 Direction: PUT
• 🎯 Strike: $626.00
• 💵 Entry: $0.57
• 💰 Target: $1.70 (+200%)
• 🛑 Stop: $0.28 (–50%)
• 📅 Expiry: Today (0DTE)
• ⚖️ Confidence: 65%
• ⏰ Entry Timing: Market Open
⸻
🧠 Multi-AI Consensus
Model Bias Action
Grok/xAI Weak Bearish ⚠️ No Trade
Claude Weak Bearish ⚠️ No Trade
Gemini Bearish ✅ $627 Put
Llama Moderately Bearish ⚠️ Conservative Put
DeepSeek Bearish ✅ $626 Put
🔹 VWAP < Price = Bearish bias
🔹 RSI = Neutral → watch for fakeouts
🔹 VIX favorable (<22)
🔹 Volume = weak = risk of whipsaw
⸻
⚠️ Risk Notes
• Bounce risk off session lows is real
• Lack of momentum may cause theta burn
• Best for scalpers who react fast — not a swing trade
• No conviction = smaller size, tighter leash
⸻
📢 Tagline (for virality):
“ AMEX:SPY is limping, not bleeding. But if it breaks, 200% comes fast. 0DTE scalpers: this is your window.” 💣

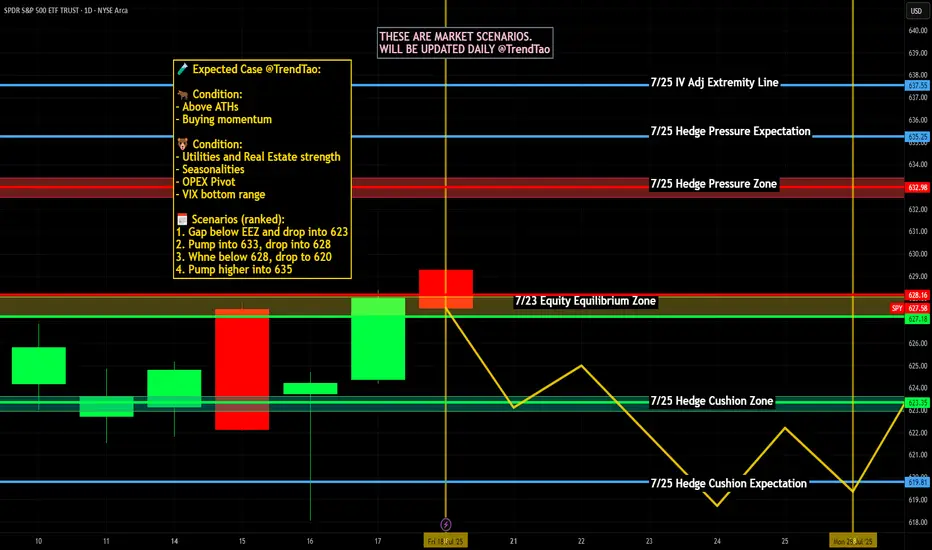
Nightly $SPY / $SPX Scenarios for July 22, 2025🔮 Nightly AMEX:SPY / SP:SPX Scenarios for July 22, 2025 🔮
🌍 Market-Moving News 🌍
🚀 Tech & EV Stocks in Focus Ahead of Earnings
Futures were quiet ahead of Tuesday’s open, but key movers included Astera Labs (+19%), Alphabet (+2.7%), Netflix +2%, and Robinhood –4.9% after being passed over for the S&P 500. Investors are positioning ahead of major tech and EV earnings this week — including Tesla, Alphabet, Lockheed Martin, Coca‑Cola, and Honeywell
📣 Powell Speech Eyed for Rate Clues
Fed Chair Jerome Powell is set to speak at 8:30 AM ET today at the Integrated Review of the Capital Framework for Large Banks Conference in D.C. Markets will be watching for any indications on future interest rate direction
🌏 Japan’s Political Shift Has Little Market Impact
Japan’s ruling coalition lost its upper-house majority over the weekend, but markets remained stable as it was largely expected. The yen held steady, and Asian equities stayed calm amid the holiday—focus remains on upcoming corporate earnings
📊 Key Data Releases & Events 📊
📅 Tuesday, July 22:
8:30 AM ET – Powell Speech: Key address at the bank regulation conference. Tone and forward guidance may sway bond and equity markets.
After Market Close – Alphabet & Tesla Earnings: Heavyweights due today—market attention will track revenue guidance, especially on advertising, EV demand, and AI.
⚠️ Disclaimer:
For educational and informational purposes only. Not financial advice—consult a licensed advisor before making investment decisions.
📌 #trading #stockmarket #tech #Fed #earnings #AI #infrastructure #volatility
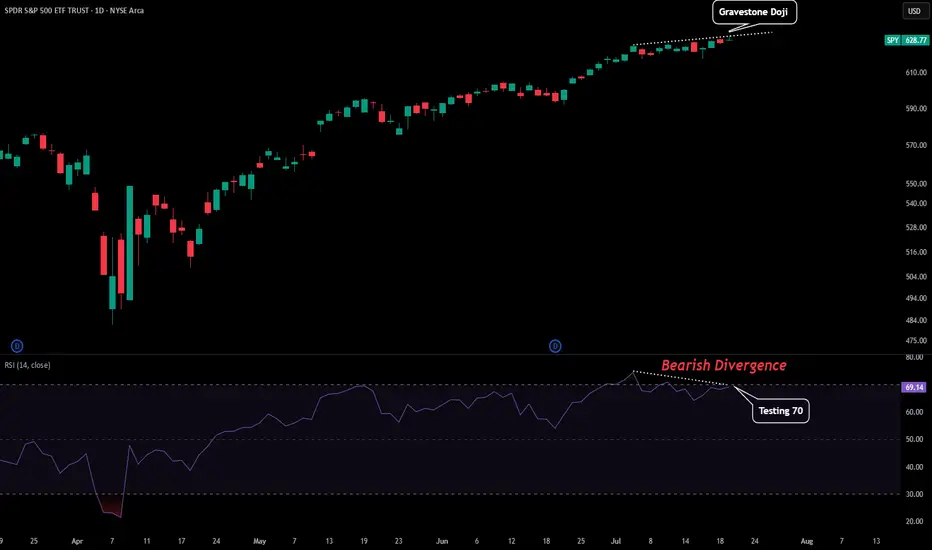
SPY - First Signs of TroubleFrom this entire uptrend we might be seeing the first signs of trouble.
Here are some reasons for this from a technical perspective:
-Daily Printed a Gravestone Doji
-RSI Testing Overbought as Resistance
-Slight Bearish Divergence on Daily RSI
-Momentum Stalling
There could also be some catalyst tomorrow that contribute to this. Powell speaks tomorrow so depending on what he says could either add fuel to a market reversal or negate these bearish signals and send us on another leg. Prepare for volatility.
July 21 Special Update : Metals, SPY & More. What's Next.This special update is to highlight why I continue to believe traders should stay very cautious of this rally in the SPY/QQQ/BTCUSD.
Underlying economic data suggest that this is one big speculative rally following the April Tariff collapse.
And, the economic data I see from my custom indexes suggests the markets are moving into a very volatile and potentially dangerous topping pattern.
As I've stated many times in this video. I'm not saying the markets have topped and you should SELL EVERYTHING. I'm suggesting this market is extremely over-valued in terms of the underlying risk factors at play and the very clear data that suggests the markets are already in a recessionary price trend.
You may ask, "How can the markets continue to rally like this in a moderate recession?".
The answer is simple.
All bubbles end with a super-speculative phase. This phase is where everyone piles into a euphoric attempt to ride the rally higher.
It happened in the late 1990s. It has happened again through the 2000-2005+ housing bubble. Heck, it has occurred in the collectors market over the past few decades where people spent fortunes on the "hottest items" (think Beanie-Babies) only to find out they bought at the height of the bubble.
That is why I continue to urge traders to remain cautious and to withdraw profits from this speculative rally phase. Protect your investment capital immediately and consider the risks associated with the information I share in this video.
I'm not trying to scare anyone. I'm just trying to be realistic in terms of what I see in my data and why I believe now is the best time to MOVE TO SAFETY.
My data suggests that the markets are about to enter a fragile and potentially dangerous pullback phase. If you want to ride it out - go for it.
Otherwise, prepare for significant volatility over the next six months or more.
Get some.
#trading #research #investing #tradingalgos #tradingsignals #cycles #fibonacci #elliotwave #modelingsystems #stocks #bitcoin #btcusd #cryptos #spy #gold #nq #investing #trading #spytrading #spymarket #tradingmarket #stockmarket #silver

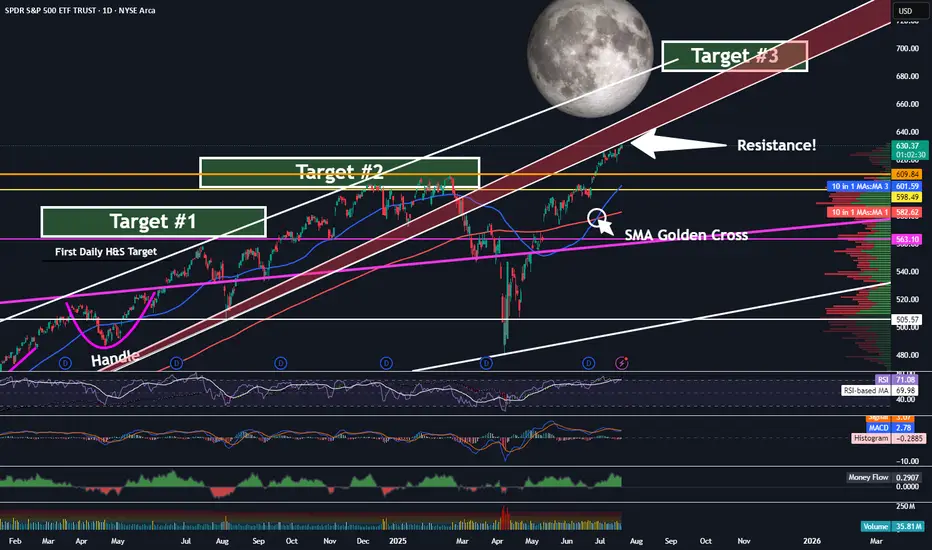
SPY - On Our Way To Target 3 ...But First?Trading Fam,
It's been a while since I updated you all on the SPY, which, as you know, we track closely to help us determine the overall market trend. Since we have now exceeded my Target #2, it's time for me to give you all another update. But first, a little context for my new readers which I have been getting a lot of recently, thanks to my new indicator hitting it out of the park.
So, we began marking targets on our chart here after spotting an inverse H&S on the daily chart a few years ago. Many of my followers back then were doubtful the pattern would fully form, or if it did, that it would actually play out. But the pattern completed about 14 months ago and subsequently broke the neckline in June of last year. I then knew we were going full send and have been predicting a 700 SPY final target since. This target has been made utilizing both that inverse H&S pattern as well as a longer-trend Elliot Wave, which I don't have denoted here at this point. The chart gets too messy with all of my markings. Regardless, we are currently in wave 5 and heading steadily towards that 670-700 target #3, my final target.
But be careful! Today, we have hit the underside of that RED area, which is HUGE resistance. I would expect that we will NOT break straight through this without some pullback prior. Indeed, the market is overextended at this moment, and we'll need the volume to be able to push through. Could this occur? Of course, anything is possible. But, it is not likely right now.
My guess is that we'll at least pull back to one of those levels below us or possibly even re-touch that 200 SMA in red before the final push.
Anyways, it is worth taking note of what may be ahead of us in the next few weeks or months so that you can plan your trades accordingly. Stay with me. We're almost there.
✌️Stew
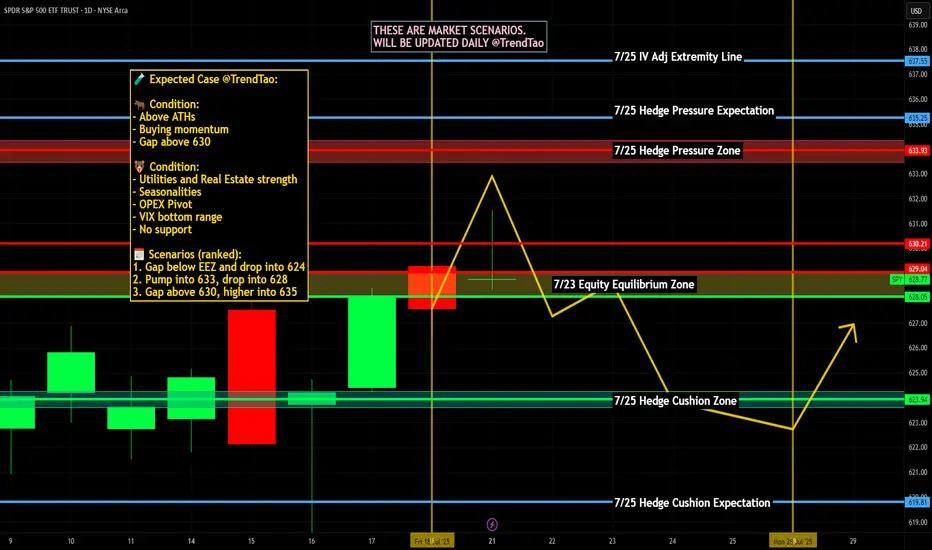
SPY: Climbing the Wall of Worry — But Is a Turn Coming?SPY: Climbing the Wall of Worry — But Is a Turn Coming?
The S&P 500 (SPY) is pushing into a critical zone as we approach July 28th, and I can’t ignore the confluence of signals piling up here.
Technical Setup
We’re testing the top of a rising wedge formation.
Key round number overhead at $640 — a psychological and options magnet.
Price is extended well above moving averages with declining volume, often a warning sign for bulls.
Multiple resistance lines converge in this zone, creating a high-pressure point.
📆 Timing Matters
July 28 = weekly options expiry — with massive open interest clustered around $630–$640.
Seasonally, late July often marks a peak before August chop.
Add in some “tin foil hat” vibes: SPY’s riding momentum while major indices are diverging (looking at you, IWM), and the macro narrative feels shaky at best.
What Would Confirm a Reversal?
Breakdown below $625 with a high-volume red candle.
Bearish engulfing or shooting star candle near resistance.
VIX divergence or big money flowing into puts mid-week.
Key Levels
Resistance: $640 / $649.90
Support: $630 / $622 / $595
Reversal target (if confirmed): $594–$575 area
Final Thoughts
As we all know, markets can stay irrational longer than you can stay solvent. However, when trendlines, round numbers, timing, and seasonality align, I start watching for cracks. This may not be the top — but it might be the spark.
Following closely. Alerts set. Ready for the flush if it comes.

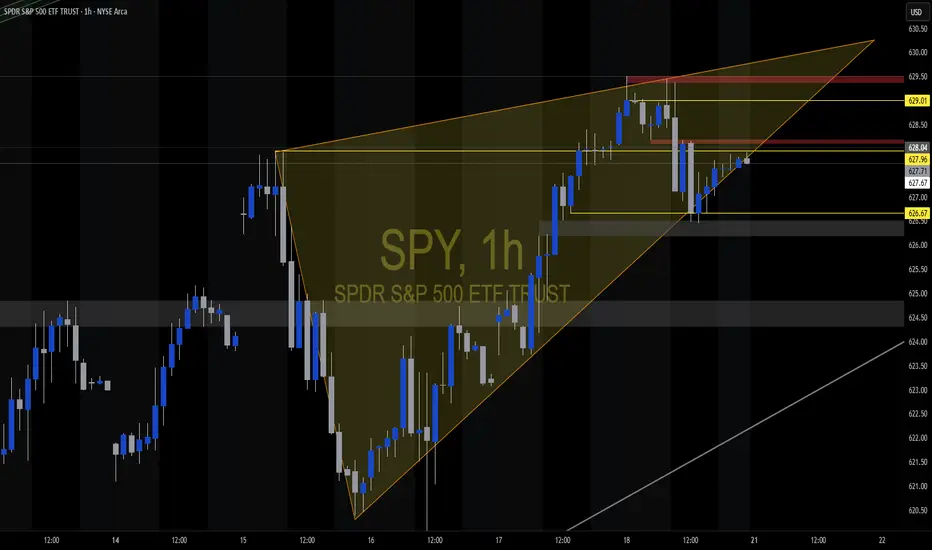
$SPY Trading Range for 7.21.25 and everything in itToday’s Trading range and everything in it. How are you playing it?
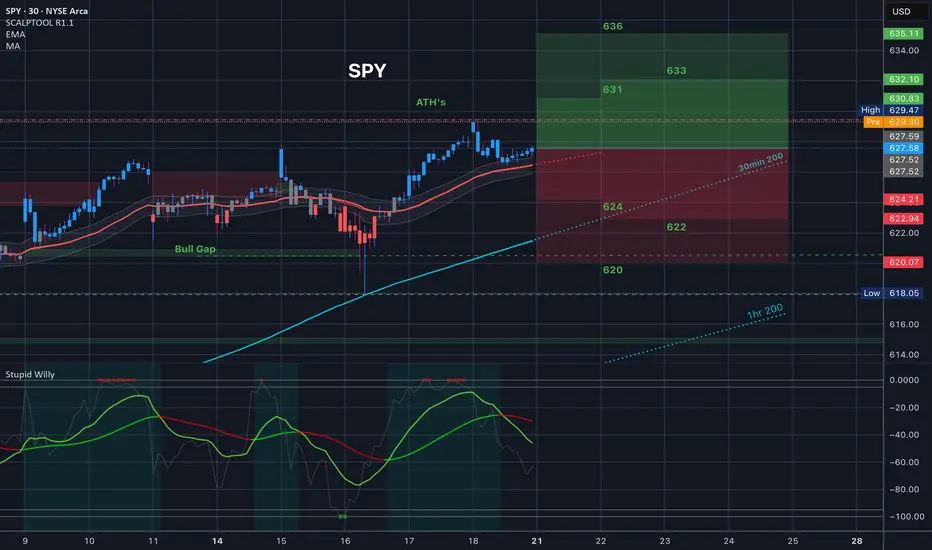
SPY July 21-25AMEX:SPY
Looking at the 4 hr. timeframe on SPY. Bearish divergence is signaling a need for some cool off. I assume this will happen almost immediately, Monday maybe into Tuesday. I expect to keep above strong support levels at 618 and 609.95. Drops below 609 will change my stance to a more bearish tone. assuming we hold these levels, I expect that SPY will continue upward after some small consolidation up here in the range. Looking at a trend-based fib, some price points to the upside above ath's(all time highs) would be 633.52 and 637.85. Even 654.
Economic and policy fundamentals could shift any bullishness into another sharp pullback or even up into higher price targets.
Not much to be bearish abut this week, earnings season is kicking off and this could play a role as well; Tesla and google & blue chips happening Tuesday- Thursday.
These earnings could be the mystery seasoning to shake up this week's movement.
Weekly $SPY / $SPX Scenarios for July 21–25, 2025🔮 Weekly AMEX:SPY / SP:SPX Scenarios for July 21–25, 2025 🔮
🌍 Market-Moving News 🌍
🏦 Fed Chair Powell Speaks — Markets Key Into Tone
Federal Reserve Chair Jay Powell’s Jackson Hole speech is the week’s centerpiece. Markets will be closely listening for clues on inflation strategy, rate-cut timing, and sensitivity to geopolitical inflation drivers like tariffs.
📦 Tariff Deadlines Gain Spotlight
Multiple tariff deadlines are set this week for targeted trade partners including the EU, Mexico, Canada, Japan, South Korea, and Thailand. Any new announcements or extensions could trigger volatility in trade-exposed sectors.
🛢️ Oil Market Mixed Signals
Brent crude prices have stabilized near mid-$70s, but OPEC+ discussions regarding supply extensions and global growth concerns continue to inject uncertainty into energy-linked equities.
📈 Big Tech Earnings Kick Off
The “Magnificent Seven” tech giants begin reporting: Nvidia leads on Tuesday, followed by Microsoft, Amazon, Alphabet, and Meta later in the week. Expect significant sentiment swings based on forward commentary.
📊 Key Data Releases & Events 📊
📅 Monday, July 21
Quiet session ahead of a packed week of speeches and data.
📅 Tuesday, July 22
8:30 AM ET – Existing Home Sales (June):
Measures signed contracts on previously owned homes—a key housing indicator.
After Market Close – Nvidia Q2 Earnings:
Market will watch guidance and China commentary.
📅 Wednesday, July 23
8:30 AM ET – Leading Economic Indicators (June):
An early gauge of U.S. economic momentum.
📅 Thursday, July 24
8:30 AM ET – Initial & Continuing Jobless Claims:
Labor-market health indicator.
📅 Friday, July 25
8:30 AM ET – Durable Goods Orders (June):
Signals demand for long-lasting goods, often driven by business spending.
8:30 AM ET – New Home Sales (June):
Follows existing home data for housing sector insight.
4:00 PM ET – Fed Chair Powell Speech at Jackson Hole:
Expect commentary on inflation, growth, and rate-path clarity.
⚠️ Disclaimer:
This content is for educational and informational purposes only and should not be construed as financial advice. Consult a licensed financial advisor before making investment decisions.
📌 #trading #stockmarket #economy #Fed #earnings #housing #durablegoods #JacksonHole #technicalanalysis