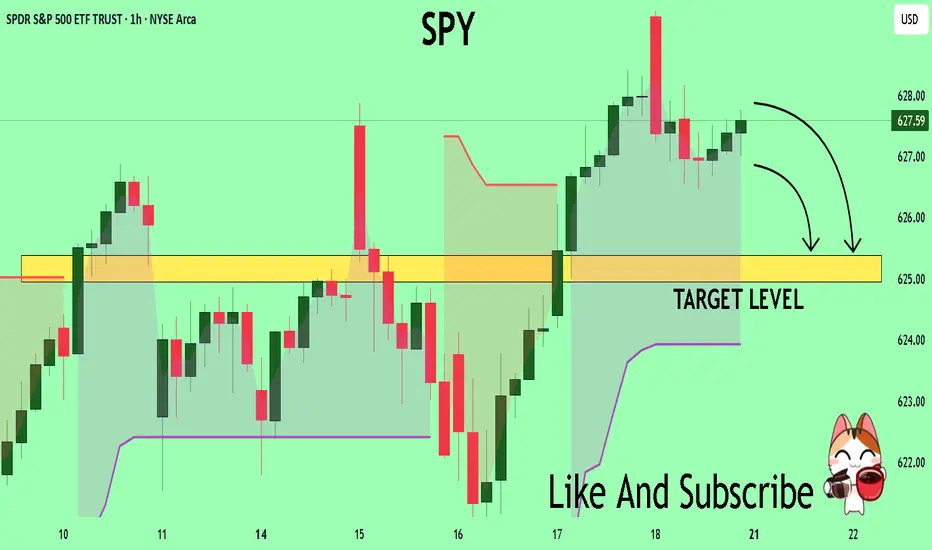
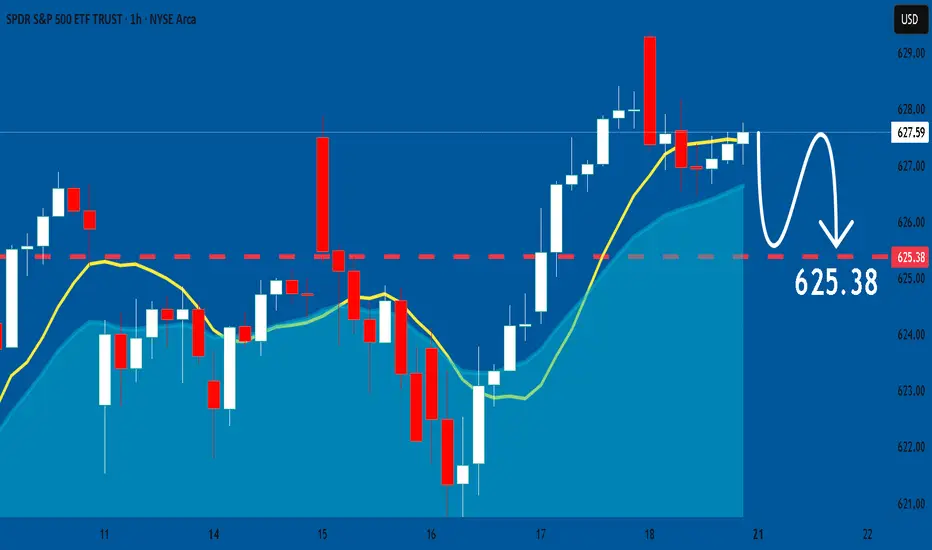
SPY What Next? SELL!
My dear friends,
Please, find my technical outlook for SPY below:
The instrument tests an important psychological level 627.59
Bias - Bearish
Technical Indicators: Supper Trend gives a precise Bearish signal, while Pivot Point HL predicts price changes and potential reversals in the market.
Target - 625.38
About Used Indicators:
Super-trend indicator is more useful in trending markets where there are clear uptrends and downtrends in price.
Disclosure: I am part of Trade Nation's Influencer program and receive a monthly fee for using their TradingView charts in my analysis.
———————————
WISH YOU ALL LUCK
SPY trade ideas
hihiThe convergence of artificial intelligence and decentralized finance presents a paradigm shift in global economic systems, where algorithmic governance, autonomous agents, and smart contracts could redefine trust, efficiency, and access. This fusion offers transformative potential but raises critical ethical, regulatory, and socio-technical challenges demanding interdisciplinary exploration and resilient systemic safeguards.
Ask ChatGPT

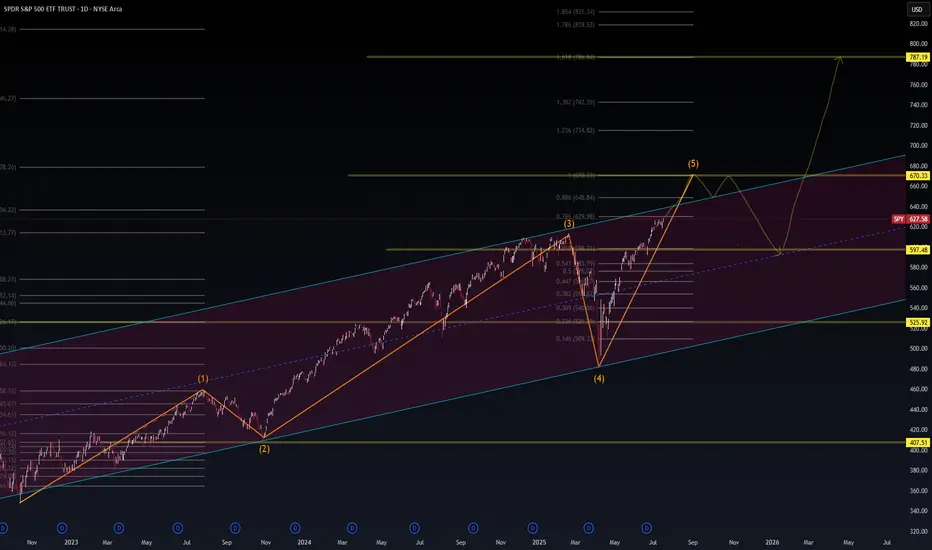
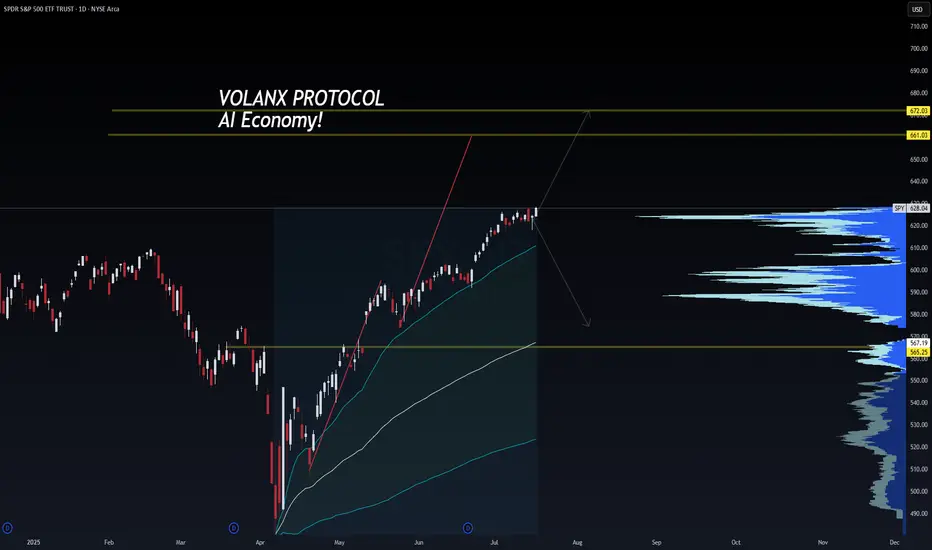
SPY Macro Wave Outlook – Bullish Fifth Wave into AI Supercy📈 SPY Macro Wave Outlook – Bullish Fifth Wave into AI Supercycle?
🧠 WaverVanir DSS | VolanX Protocol | Institutional AI Alignment
The SPY rally appears to be unfolding within a 5-wave macro impulse, currently inside Wave (5) targeting the 670–787 zone, depending on macro alignment and Fed behavior. This structure converges with long-term Fibonacci clusters and macro transition signals.
🔍 Thesis:
Wave (5) in Progress – Next resistance seen at ~670.33, followed by long-term targets near 787.19.
Pullback Scenario – A temporary correction into the 597–600 range is possible before further upside.
Structure Validity – Channel and Fibonacci extensions confirm bullish continuation unless macro conditions deteriorate sharply.
🧠 Macro Alignment Required:
Fed Pivot Late 2025 → Probability: 60%
Earnings Growth Led by AI → 11% projected for S&P500 (GS)
Productivity > Consumption → AI-led industries showing 5%+ labor productivity growth (Dallas Fed)
Low Inflation Reacceleration Risk → Core PCE stabilization key
⚠️ Risk Matrix:
Macro Risk Probability Notes
Fed Hawkish Reversal 30% Data-dependent but unlikely unless inflation re-flares
AI Concentration Shock 25% Tech-heavy rally, breadth remains a concern
Valuation Compression 20% Shiller CAPE near 37
Trade War Reignition 15% Tariff risk remains a geopolitical tail
🎯 Target Zones:
Near-term: 670.33 (Wave 5 peak)
Medium-term: 714–787 (Fib clusters)
Correction Zone: 597–600, invalidation below 525
The AI economy is accelerating—productivity is now outpacing consumption in several sectors. This macro regime shift could be the foundation for the next secular bull wave.
🔺 Powered by VolanX Protocol
⚠️ Not financial advice. Educational chart generated by institutional DSS models.
#SPY #VolanX #WaverVanir #ElliottWave #MacroTrading #AIProductivity #Fibonacci #FedPivot #USEquities #TradingSignals #SmartMoneyConcepts #InstitutionalStrategy #AIInvesting #SP500
SPY: Week of Jul y21stPosting an idea on SPY against better judgement.
Its a mess of an index but here is my attempt at an analysis with this trainwreck, haha.
Best of luck, safe trades and take care!

Stock Market Forecast | TSLA NVDA AAPL AMZN META MSFTStock Market Forecast | CME_MINI:NQ1! CME_MINI:ES1!
Mag 7 Forecast | NASDAQ:TSLA NASDAQ:NVDA AAPL AMZN META MSFT GOOG

SPY: Market of Sellers
Our strategy, polished by years of trial and error has helped us identify what seems to be a great trading opportunity and we are here to share it with you as the time is ripe for us to sell SPY.
Disclosure: I am part of Trade Nation's Influencer program and receive a monthly fee for using their TradingView charts in my analysis.
❤️ Please, support our work with like & comment! ❤️
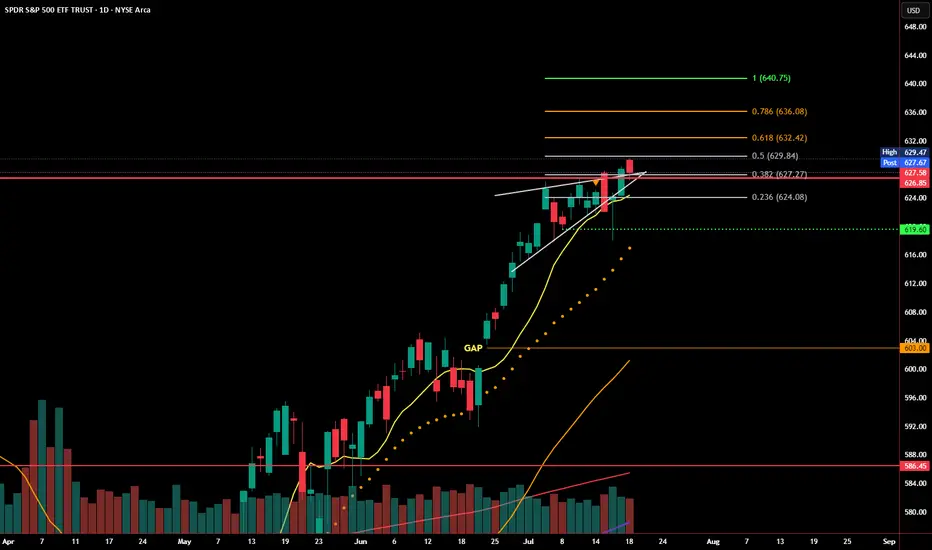
SPY Reclaims Rising Wedge Support - Bear Trap or Breakout Setup?SPY dropped below its rising wedge earlier this week, but that move may have been a bear trap. Price quickly reversed, reclaiming the wedge trendline and closing just below a key Fibonacci level at 629.84.
Buyers stepped in aggressively near the 0.382 and 0.236 retracement zones, defending short-term support. The bounce came on increased volume, signaling strength behind the recovery. Momentum remains intact as long as SPY holds above 626.
Now, bulls need to confirm with a breakout above 629.84–631.96 to open the door to the next levels at 635.63 and 640.30. Failure to break through could lead to another rejection and revisit lower support zones.
Levels to watch:
Support: 626.64, 623.62, 619.60
Resistance: 629.84, 631.96, 635.63
SPY is at a decision point. Reclaiming wedge support is a bullish signal, but bulls need follow-through to avoid another fakeout in the opposite direction.
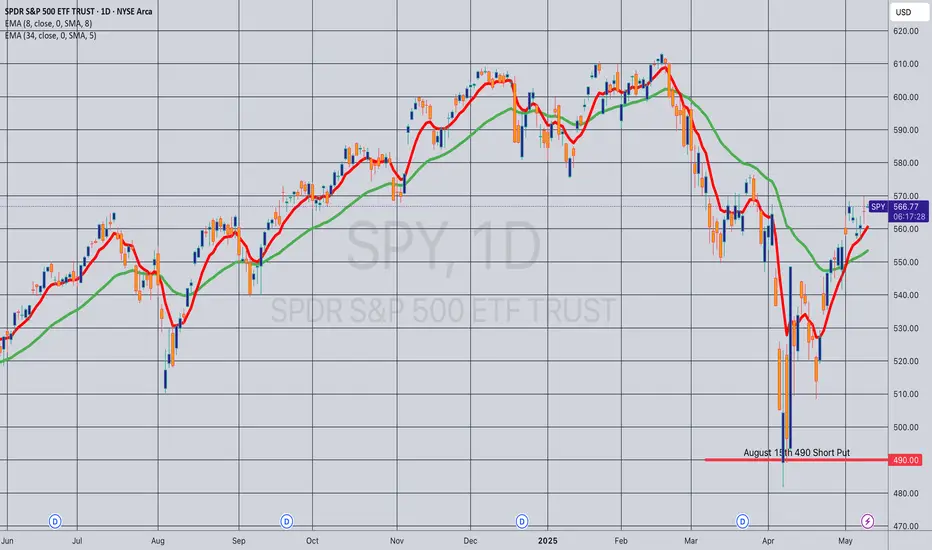
Opening (IRA): SPY August 15th 490 Short Put... for a 5.00 credit.
Comments: Laddering out, targeting the strike paying around 1% of the strike price in credit ... .
Will generally look to roll up to the shortest duration <16 delta strike paying 1% of the strike price if in profit.
Earnings Heat Up - 6300 and 6200 SPX Key Levels RemainMarket Update
SPX Key Levels
-SPX poked 6300 Tuesday, Thursday, and poked higher Friday (but settled back to 6300)
-6200 support remains a key level
-6050/6000/5800 next floor levels, I'll be looking for dips
I can see the market slowly (and I mean SLOWLY) grinding higher but preparing for a
reasonable seasonal selloff through end of July into end of September window
July 28-August 1 is a monster week in the markets
-Megacap Earnings (MAG7 Tue/Wed/Thu)
-Wed July 30 - FOMC (Pause expected but Powell's Press Conference is important)
-Friday August 1 - Non-Farm Payroll, Tariff Deadline
I'm hitting fresh YTD highs so I'm not complaining about this melt-up and grind, I'm simply wanting to allocate positions and add to my positions at better levels and with a slightly
higher VIX to help take advantage of the expected move being greater than the actual move
Have a great weekend and thank you watching!!!

SPY risk on for a few weekslooks like we are still moving up (SPX 6,400-6,500) but the risk to a correction is increasing.
FOMO phase on meme stock. so still profit to be had

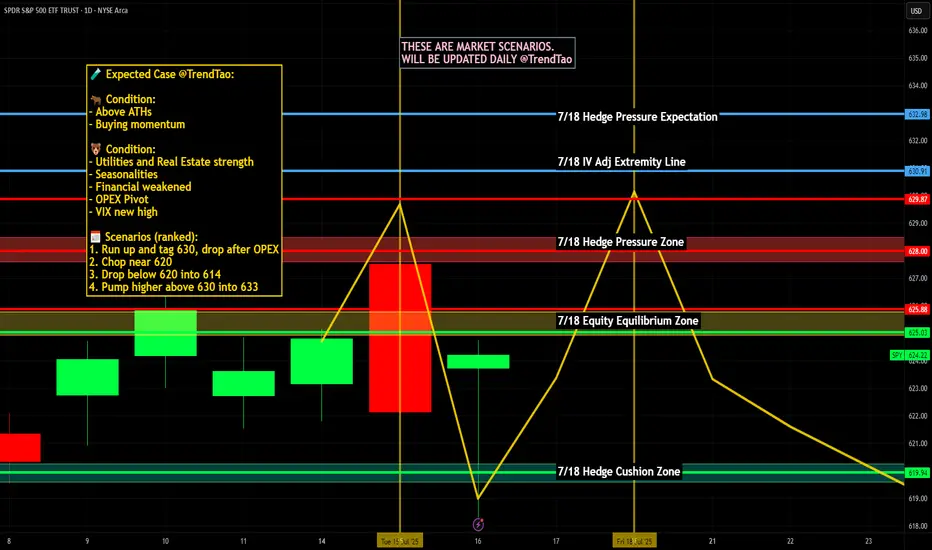
Nightly $SPY / $SPX Scenarios for July 19, 2025🔮 Nightly AMEX:SPY / SP:SPX Scenarios for July 19, 2025 🔮
🌍 Market-Moving News 🌍
🏢 U.S. Corp Buybacks Set to Propel Stocks
Citadel Securities expects U.S. companies to repurchase roughly $1 trillion of stock in 2025. With the blackout period ending in August, buybacks—historically strong in July, the stock market’s best month—could bolster valuations
⚖️ Fed Independence Debate Intensifies
President Trump’s continued criticism of Chair Powell has already weakened confidence in Federal Reserve autonomy. The fallout shows up in a weaker dollar, elevated Treasury yields, and rising inflation expectations—though stocks have remained resilient
🇺🇸 Immigration Rollback Sparks Economic Concern
The rescinding of Temporary Protected Status for ~900,000 immigrants could remove up to 1.1 million workers from the labor force. Analysts warn of potential stagflation risks, with GDP growth potentially down 0.3–0.4 percentage points and labor-market tightening ahead
💵 Massive T-Bill Issuance Incoming
Following the debt-ceiling deal, the Treasury plans over $1 trillion in T-bill issuance in the next 18 months. Money-market funds are expected to absorb much of it, influencing short-term rates and cash-market dynamics
📊 Key Data Releases & Events 📊
📅 Friday, July 19:
8:30 AM ET – Initial Jobless Claims
Weekly figure on new unemployment filings—a real-time indicator of labor-market resilience.
8:30 AM ET – Existing Home Sales (June)
Measures signed contracts on previously owned homes; key for gauging housing-market health.
All Day Events:
Ongoing corporate buybacks entering open window
Treasury auctions and T-bill issuance updates
⚠️ Disclaimer:
This information is for educational and informational purposes only and should not be construed as financial advice. Always consult a licensed financial advisor before making investment decisions.
📌 #trading #stockmarket #economy #monetarypolicy #debt #housing #labor #technicalanalysis
Elliott Wave Analysis: SPY Poised To Extend Higher In Bullish SeElliott Wave sequence in SPY (S&P 500 ETF) suggest bullish sequence in progress started from 4.07.2025 low. It expects two or few more highs to extend the impulse sequence from April-2025, while dips remain above 6.23.2025 low. SPY ended the daily corrective pullback in 3 swings at 480 low on 4.07.2025 low from February-2025 peak. Above there, it favors upside in bullish impulse sequence as broke above February-2025 high. Currently, it favors wave 3 of (1) & expect one more push higher from 7.16.2025 low in to 630.31 – 651.1 area before correcting in wave 4. In 4-hour, it placed 1 at 596.05 high, 2 at 573.26 low as shallow connector & extend higher in 3. Within 3, it placed ((i)) at 606.40 high, ((ii)) at 591.89 low, ((iii)) at 627.97 high & ((iv)) at 618.05 low.
In 1-hour above ((ii)) low of 591.89 low, it ended (i) at 605.96 high, (ii) at 603.17 low, (iii) at 626.87 high as extended move, (iv) at 620 low & (v) as ((iii)) at 627.97 high. Wave ((iv)) ended in 3 swing pullback as shallow connector slightly below 0.236 Fibonacci retracement of ((iii)). Within ((iii)), it ended (a) at 619.8 low, (b) at 624.12 high & (c) at 618.05 low on 7.16.2025 low (this week). Above there, it favors rally in ((v)) of 3 targeting in to 630.31 – 651.1 area before correcting in 4. Within ((v)), it placed (i) at 624.73 high, (ii) at 623.08 low & favors upside in (iii) of ((v)). We like to buy the pullback in clear 3, 7 or 11 swings correction at extreme area in 4 and later in (2) pullback, once finished (1) in 5 swings.

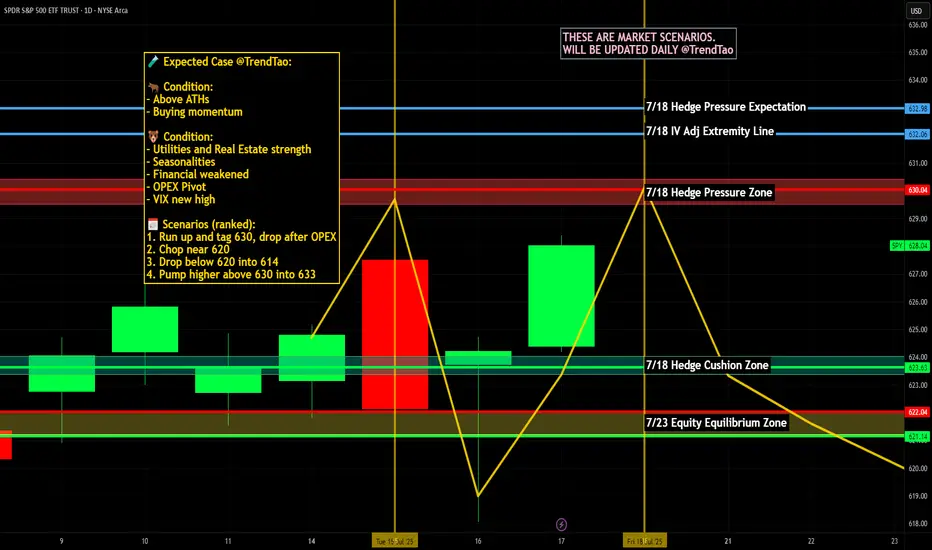
SPY 628 – Compression Before Expansion | VolanX Protocol Engaged🧠 SPY 628 – Compression Before Expansion | VolanX Protocol Engaged
📅 July 17, 2025
🔍 SPY (S&P 500 ETF Trust) | 1D Chart
📍 Current Price: 628.04
📈 Chart Thesis by: WaverVanir International LLC
🔗 Powered by VolanX Protocol
🌐 Macro Overview:
The market stands at a critical inflection point, with bulls and bears both pressing their narrative:
The Fed is expected to cut rates in September, with soft CPI and decelerating labor trends justifying a pivot.
Earnings season is bifurcated: Mega-cap tech is leading, while cyclicals are faltering. This raises the risk of a short-term rally masking deeper fragility.
Global macro risks – including rising geopolitical stress in the Asia-Pacific region and commodity volatility – increase the odds of a tail event.
📊 Technical Outlook:
SPY is now hugging a major supply zone near 628 with price stalling for multiple sessions. This area marks a compressed equilibrium where volatility is likely to expand soon. Key technicals:
Rejection candles suggest seller presence near 630.
Price is overextended but remains above all major EMAs.
Breakdown zone sits at 565, which aligns with prior resistance and a major volume shelf.
No current bearish divergence on RSI or MACD, but momentum is flat.
🎯 VolanX Probabilistic Bias:
The system currently anticipates three paths:
Bullish breakout toward 660–675 if the Fed confirms a dovish stance and tech continues to lead.
Neutral grind in the 600–615 zone if macro remains balanced and earnings don’t surprise.
Bearish breakdown to 565 or lower if macro stress emerges or dollar strength accelerates.
🛠️ Options Strategy Highlights:
Bullish Trade Idea: Buy 630C / Sell 660C (30–45 DTE) – Low cost, targets breakout above resistance.
Bearish Trade Idea: Buy 620P / Sell 565P – High R/R play into macro unwind.
Both are defined-risk strategies, ideal in volatile inflection zones like this.
⚠️ VolanX Note:
This is a classic binary event structure forming under institutional watch. DSS scans show compression is now mature. Whichever side confirms will likely trigger a large move, not a drift.
Let the narrative confirm the signal.
⚠️ This post is for informational and educational use only. Not financial advice.
#SPY #VolanX #MacroTrading #OptionsFlow #WaverVanir #FOMC #AIeconomy #LiquidityWave #TradingSignals
Climbed too fast to the top of the channel?Weekly chart on log - looks like its already topped out and will likely hit one of those targets in the coming weeks. Maybe a test or slight break above channel before going down.

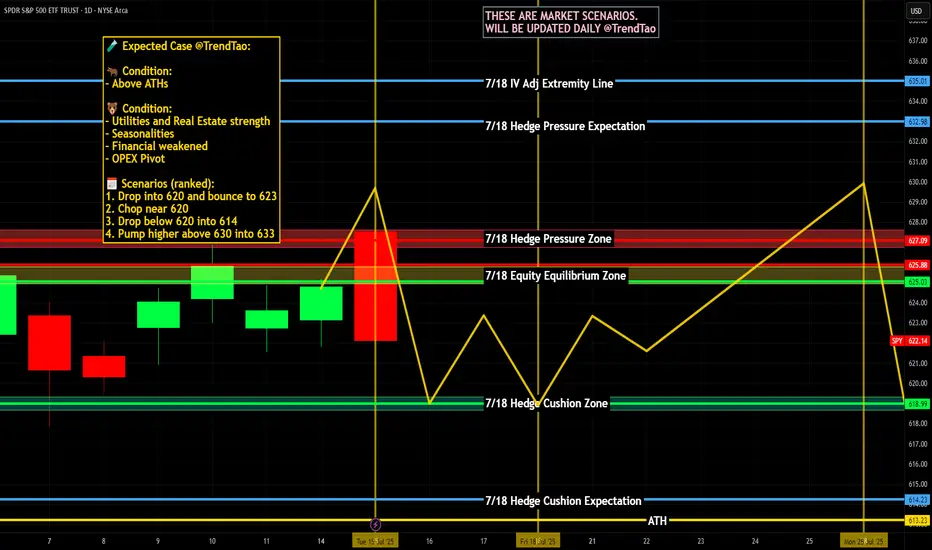
Nightly $SPY / $SPX Scenarios for July 17, 2025🔮 Nightly AMEX:SPY / SP:SPX Scenarios for July 17, 2025 🔮
🌍 Market-Moving News 🌍
🇮🇳 India–U.S. Inflation Divergence Dampens Dollar
India’s June retail inflation tumbled to a six-year low, while U.S. CPI hit its fastest pace since February—driven by tariff effects. This divergence is weakening the U.S. dollar against the rupee, pushing down dollar‑rupee forward premiums
📜 Treasury to Ramp Up T-Bill Issuance
Following the recent debt-ceiling increase, the U.S. Treasury plans to issue over $1 trillion in T-bills over the next 18 months. Money-market funds, flush with cash, are expected to absorb the supply, which could influence short-dated yields
💱 Dollar Eases Amid Fed-Related Volatility
Headline news that President Trump “highly unlikely” to fire Fed Chair Powell, coupled with stable PPI data, calmed markets. The dollar dipped slightly after earlier turmoil, while gold and bonds saw modest gains
📊 Key Data Releases & Events 📊
📅 Thursday, July 17:
(No major U.S. economic releases)
Markets will track T-bill issuance plans, dollar forward dynamics, and statements from the Treasury and Fed regarding debt and rate strategy.
⚠️ Disclaimer:
This is for educational purposes only—not financial advice. Consult a licensed financial advisor before making investment decisions.
📌 #trading #stockmarket #economy #dollar #tbills #inflation #Fed #technicalanalysis
SPY (SP-500) - Rising WedgeYesterday we had a breakdown of the rising wedge on SPY. I draw out some important levels to look out for coming days/weeks. The trendline since april has also been broken. ICEUS:DXY is breaking out to which is increasing the risks for a "Risk off" scenario in tech stocks and crypto.
Nothing here should be interpreted as financial advise. Always do your own research and decisions.

SPY PRICE ACTION 16 JULY 2025This is the price action of spy at its very best as always. I have clearly discussed the important levels & have also discussed the momentum as well.
Feel free to leave your comment
NOTE:I AM NOT TRADING SPY

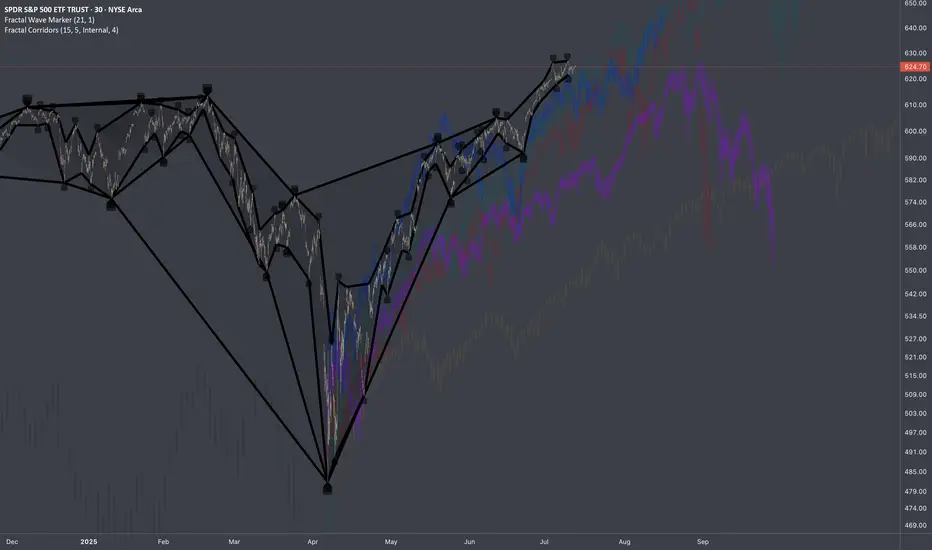
SPY/QQQ Plan Your Trade Special Update : BUCKLE UPThis video is a special update for all TradingView members. I felt I needed to share this information and present the case that I believe poses the most significant risk to your financial future - and it's happening right now.
Several weeks ago, I identified a very unique mirror setup in the SPY and kept an eye on how it was playing out. I needed to see confirmation of this setup before I could say it had any real likelihood of playing out as I expected.
As of today, I'm suggesting that we now have excellent confirmation that the US/Global markets are about to enter a deep consolidation phase, lasting through the rest of 2025 and possibly into 2026 and early 2027.
The interesting thing about this price pattern/structure is that it is almost exactly the same as the 2003-2007 structure, which I believe is the origin of this mirror setup. Almost down to the exact type of price bars/patterns I'm seeing.
Many of you are already aware that I've been calling for a critical low cycle in the SPY on July 18 for many months. What you may not realize is that the pattern is based on Weekly price data. The July 18 cycle low can have a span of +/- 1-3 weeks related to when and how the cycle low pattern plays out.
Watch this video. If you have any questions, message me or comment.
I'm still here, doing my best to identify and unlock the secrets of price action and to help as many traders as I can.
Price is the Ultimate Indicator.
Get some.
#trading #research #investing #tradingalgos #tradingsignals #cycles #fibonacci #elliotwave #modelingsystems #stocks #bitcoin #btcusd #cryptos #spy #gold #nq #investing #trading #spytrading #spymarket #tradingmarket #stockmarket #silver

Nightly $SPY / $SPX Scenarios for July 16, 2025 🔮 Nightly AMEX:SPY / SP:SPX Scenarios for July 16, 2025 🔮
🌍 Market-Moving News 🌍
📈 Record Bullish Sentiment Signals Rotation
Bank of America reports the most bullish fund-manager sentiment since February. With 81% expecting one or two Fed rate cuts this year, the group sees a rotation strategy replacing outright selling, with investors tipping toward sector shifts over wholesale exits
⚠️ Trump’s Fed Attacks Stir Policy Concerns
President Trump’s public criticism of Fed Chair Powell—calling for steep rate cuts and threatening removal—has raised market alarms over the central bank’s independence. Analysts warn such interference could destabilize confidence in U.S. monetary policy
🏦 Banks Prepare for Earnings Surge
Major U.S. banks are expected to report strong Q2 results this week. Enhanced trading and investment banking revenues are forecasted to offset economic uncertainties tied to tariffs
📡 Nvidia CEO to Visit Beijing
Jensen Huang is set to hold a high-profile media briefing in Beijing on July 16, signaling continued emphasis on China for Nvidia despite U.S. export restrictions—potentially a key narrative for tech markets
📊 Key Data Releases & Events 📊
📅 Wednesday, July 16:
8:30 AM ET – Producer Price Index (June)
Gauges wholesale inflation pressures; June expected +0.2% MoM vs May’s +0.1%
9:15 AM ET – Industrial Production & Capacity Utilization (June)
Monitors factory and utilities output and usage rates—key for industrial-sector health
Jensen Huang in Beijing
Nvidia CEO to lead media briefing in Beijing—a potential market mover for chipmaking and AI sectors
⚠️ Disclaimer:
This info is for educational purposes only—not financial advice. Consult a licensed professional before making investment decisions.
📌 #trading #stockmarket #inflation #Fed #tech #industrial #PPI
Potential Reversal - signs to look forSPY likely reaches 615 this week, if it gets under it will be a change of character. Gold still choppy, nothing decided just yet. Oil also undecided. Nat Gas may pullback from it's breakout. BTC looks like it may have at least a good pullback.

SPY is about to dumpThere isn't much to say. Chart speaks for itself. Possible shark farming if we hit resistance at this trendline that was resistance since 2022. Not shown but its also at the 707 extension of the October '24 and April '25 low.

$SPY Trading Range for 7.15.25 and everything in it for CPI
Tomorrow’s Trading range and everything in it. How are you playing it?

$SPY: Composite Sub-Cycles (Recursive)Research Notes Documenting Commonality
I’ve identified several bar patterns that formed following significant historical declines. They share notable similarities, as if suggesting that the magnitude of past major moves sets the structure of subsequent groups of sub-cycles (which I call "building blocks" sometimes).
I placed them in respect to current scaling laws so the method of exclusion can be applied in order to familiarize with typical "terrain" of price dynamics at such phase. Documenting them because a direct study is the most effective approach to uncovering the essence of recursive patterns.
Some of the bar patterns are lowered to highlight temporal aspect which matters more than price scale.