Why on Earth anyone invests in the Australian Shares? (SPX)The last 16 years. The US S&P 500 index (in red) Vs the Australian All Ordinaries index. The US broad market index up by 607%, the Australian index up by 58%. The US S&P 500 index is a broad measure of the top 500 companies in the US, and the All Ordinaries likewise from the largest 500 companies listed in Australia. The US represents about 25% of Global GDP Vs Australia at 1.6%. The US S&P500 index companies also earn about 40% of their earnings from outside America (due to their Global reach). Their companies also lead in tech, banking, defense etc. Why does anyone invest solely in the Australian share markets? The Australian index is very narrowly weighted to the big 4 banks (mostly leveraged on Australian residential real estate), and the large miners (leveraged on the commodity cycle). Both very narrow, non-diversified risky strategies, and clearly over the long term a crap investment compared to the breath of risk and performance outcomes of the US multinational giants of expansion and leading edge innovation.
XAO trade ideas

Australian Stock Market #AORD #ASX200 Breakout! New Highs.Yet if you read the financial press to make your investment decisions
You would be de risking when you should be putting the pedal to the metal.
Inverse Head and Shoulders points to a whopping price from here once the neckline is broken.

ASX - Australian Stock Market Also Points To A Top...Studying the Dow Jones extensively over the years has been enlightening, but unraveling the patterns within the ASX has always presented a unique challenge. Despite their differences, I believe the outcome from this juncture will remarkably mirror each other, signifying an imminent peak. Witnessing charts with distinct patterns eventually converge in their own distinctive way is truly captivating. I consider this observation crucial, offering an alternative perspective on the impending significant decline within a larger Wave E, typically preceding substantial bull markets. While the exact depth of this decline remains uncertain, I'm putting forth this idea to gauge its proximity to the actual outcome. The convergence of Dow Jones and the ASX, both hinting at an impending downturn, is likely to trigger more stimulus, potentially fueling inflation and higher rates in the future. More significantly, it should act as the catalyst for the next crypto bull market.

asx and xaoQRE Betashares Australian Resources Sector ETF 20,668,595
QFN Betashares Australian Financials Sector ETF 3,530,006
USD Betashares U.S. Dollar ETF 8,218,740
QAU Betashares Gold Bullion ETF – Currency Hedged 27,786,377
EEU Betashares Euro ETF 440,000
POU Betashares British Pound ETF 597,235
OOO Betashares Crude Oil Index ETF – Currency Hedged (Synthetic) 32,491,373
AAA Betashares Australian High Interest Cash ETF 63,099,171
QOZ Betashares FTSE RAFI Australia 200 ETF 28,068,805
QUS Betashares S&P 500 Equal Weight ETF 4,895,883
NDQ Betashares NASDAQ 100 ETF 92,938,113
HEUR Betashares Europe ETF - Currency Hedged 3,437,643
HJPN Betashares Japan ETF - Currency Hedged 4,424,146
FUEL Betashares Global Energy Companies ETF – Currency Hedged 33,080,561
MNRS Betashares Global Gold Miners ETF – Currency Hedged 10,632,171
BNKS Betashares Global Banks ETF – Currency Hedged 7,544,574
DRUG Betashares Global Healthcare ETF – Currency Hedged 20,191,319
FOOD Betashares Global Agriculture Companies ETF – Currency Hedged 18,760,297
HACK Betashares Global Cybersecurity ETF 78,242,268
EX20 Betashares Australian Ex-20 Portfolio Diversifier ETF 11,696,784
ETHI Betashares Global Sustainability Leaders ETF 204,270,167
QPON Betashares Australian Bank Senior Floating Rate Bond ETF 33,571,332
FAIR Betashares Australian Sustainability Leaders ETF 69,107,113
A200 Betashares Australia 200 ETF 24,805,801
CRED Betashares Australian Investment Grade Corporate Bond ETF 23,155,841
ASIA Betashares Asia Technology Tigers ETF 65,893,790
RBTZ Betashares Global Robotics and Artificial Intelligence ETF 15,241,015
INCM Betashares Global Income Leaders ETF 1,625,341
QLTY Betashares Global Quality Leaders ETF 15,288,364
F100 Betashares FTSE 100 ETF 41,721,942
AGVT Betashares Australian Government Bond ETF 9,934,793
IIND Betashares India Quality ETF 7,466,390
GBND Betashares Sustainability Leaders Diversified Bond ETF - Currency Hedged 12,722,820
DZZF Betashares Ethical Diversified High Growth ETF 2,195,965
DHHF Betashares Diversified All Growth ETF 8,305,126
DGGF Betashares Ethical Diversified Growth ETF 1,361,085
DBBF Betashares Ethical Diversified Balanced ETF

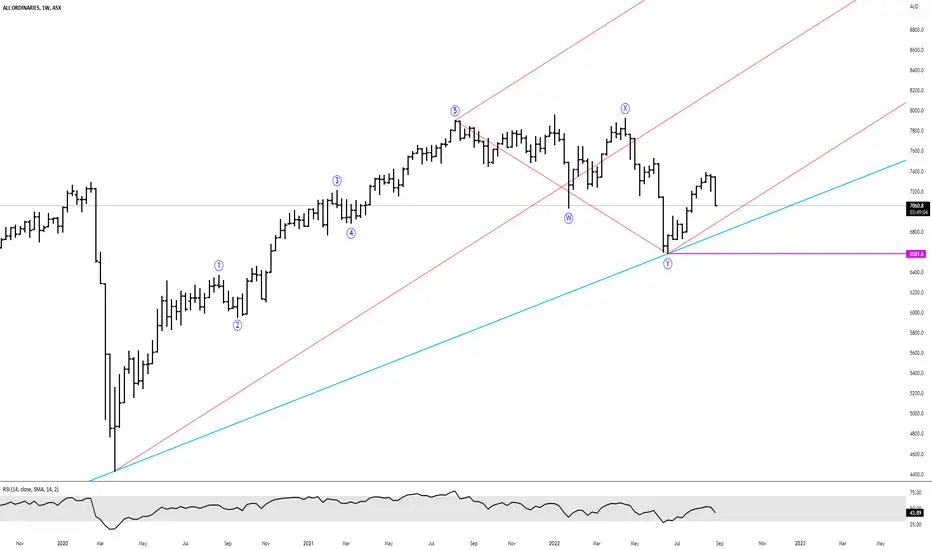
XAO's possible pathSince October, the Australian All Ordinaries index has been steadily climbing along its bullish uptrend line, demonstrating resilience despite a few zigzags along the way. The index has now touched this rising trend line for the third time, signaling the possibility of further rallies to come - potentially up to the horizontal pink resistance line - before pulling back to the upward trending redline.
Alternatively, it is conceivable that the index could break through the pink resistance line altogether, propelling it up to the purple line at the top of the chart. Should this occur, it would mark a significant inflection point as it represents previous highs.
It is important to note, however, that the current rally may not be fully supported by the fundamentals of the Australian economy. Accordingly, the purple line may well represent the upper limit of this upward trend.
Nonetheless, we maintain a bullish outlook until the upwards trend line is broken, and will continue to closely monitor the index as it progresses.

AORD - Last trading day of DecemberSince 2000, the All Ordinaries Index ( AORD ) has displayed a negative seasonal tendency on the last trading day of December.
1-day average return -0.21%, standard deviation 0.72%, win rate 5 from 22 events.
Last year marked the 12th consecutive loss for the All Ordinaries Index on the last trading day of the calendar year. Will the positive lead from the US equity market overnight be enough to end this losing streak?
Disclaimer: Past performance is not a guide to future performance and may not be repeated. Past performance does not diminish the risk expectancy of any strategy. By its very nature ‘risk’ means you could & most likely will experience losses. No representation or warranty is given as to the accuracy or completeness of any information provided. It is your responsibility to consider whether any financial product or service is suitable for you based on your risk profile, investment objectives, & investment horizon. Data is for educational & informational purposes only.

AORD - Last 3 days of December & 1st 2 days of JanuarySince 2000, the All Ordinaries Index (AORD) has displayed a positive seasonal tendency over the last 3 trading days of December & first 2 trading days of January.
5-day average return 1.04%, standard deviation 1.19%, win rate 17 from 22 events.
In terms of statistical significance, the conditional 5-day average return of 1.04% versus the unconditional 5-day average return (drift) of 0.09%, is statistically significant well beyond the conventional 1 in 20 by chance level (P < 5%).
With regard to return skew, 10 of these events sported an absolute gain of greater than 1% while no events posted an absolute loss on the southern side of -1%.
Disclaimer: Past performance is not a guide to future performance and may not be repeated. Past performance does not diminish the risk expectancy of any strategy. By its very nature ‘risk’ means you could & most likely will experience losses. No representation or warranty is given as to the accuracy or completeness of any information provided. It is your responsibility to consider whether any financial product or service is suitable for you based on your risk profile, investment objectives, & investment horizon. Data is for educational & informational purposes only.

XAO Bottom & Top pattern targets.All on the chart for educational purposes only.
COVID base pattern target was met ( near enough is good enough for me).
Will the current downside target also be met ?

Looks Easy Yea?looks like this up/down leg has completed and we have made a bottom/low for now - if we break below our purple line my views are wrong and we're probably heading for a deeper correction.
XAO - Performance following Federal ElectionSince 1980, the average 3-month performance of the All Ordinaries Index following a Federal Election is similar after both Labor & Liberal victories. However, the data is consistent with random & statistically insignificant when compared to average 3-month drift.
Disclaimer: This data is not financial advice. Past performance is not a guide to future performance and may not be repeated. Past performance does not diminish the risk expectancy of any strategy. By its very nature ‘risk’ means you could and most likely will experience losses. No representation or warranty is given as to the accuracy or completeness of any information provided. Data is for educational and informational purposes only.

Watching XAOLaying in wait for a move.
NASDAQ dropping, Russian Conflict, Pandemic, 'Chinese' problems (apparently) in the islands.
Volatility equals big movements, big movements equal big rewards and big risks.
No movement equals stagnation, no one's interested, so no ones putting in or pulling out, simply waiting.
Purple/Yellow is the whole market regression trend... Currently, monthly 50ma is on the mean of the regression trend
Im currently waiting...

All Ordinaries Index - Following 4 Consecutive Down WeeksThe All Ordinaries Index has just recorded 4 consecutive down weeks. Since 2000, following this type of weekly downward persistence, the 6-week forward interval had a tendency to yield a reasonable result. 6-week average return 3.58%, 17 up, 4 down, median 4.04%, standard deviation 5.84%, maximum 16.06%, minimum -9.40%.
Adding a volatility trending higher filter to this data (50-day average of absolute daily deviation is higher than 200-day average of absolute daily deviation), & reducing the outlook period from weekly to daily, suggests a reasonable 19-day forward outcome. 19-day average return 4.22%, 10 up, 1 down, median 4.21%, standard deviation 5.35%, maximum 11.54%, minimum -8.19%.
Disclaimer: This data is not financial advice. Past performance is not a guide to future performance and may not be repeated. Past performance does not diminish the risk expectancy of any strategy. By its very nature ‘risk’ means you could and most likely will experience losses. No representation or warranty is given as to the accuracy or completeness of any information provided. Data is for educational and informational purposes only.

XAO 8 years of gains in 15 months
Ascending wedge
Indicators screaming overbought
Momentum slowing down and making lowers highs.
What's going to be the straw that breaks the camels back?

All ORDS Continues to be Volatile & Rangebound Traders across markets have taken that as a sign that the Fed might be more aggressive about rolling back the stimulus that has been feeding stock market gains across geographies. ASX All Ords trading on a similar path. It trading near all-time high but not crossing the high levels and will continue to be volatile. As per Finasko.com, XAO closed with the gain of 1.24% at 7774.40

All Ordinaries Index | 7 Consecutive Quarterly Gains December 2021 marked 7 Consecutive Calendar Quarter Gains for the All Ordinaries Index. Data paucity caveats aside; What does this streak of quarterly gains portend for the Quarter ending March 2022? Momentum or Reversal? The historic record sides with Momentum.
Disclaimer: This data is not financial advice. Data is for educational & informational purposes only & should not be used to make any investment decisions. No representation or warranty is given as to the accuracy or completeness of this information. Past performance is not a guide to future performance & may not be repeated.

XAO has not changed its trend yet. My view and analysis is The XAO has NOT proven that its broken out of its downtrend yet. I continue to see lower highs and the Trend does not look to have changed as of yet. In a previous accumulation Period which was similar I could see the pattern was also different to this one. I think we are in different waters here and the outcome is still waiting to play out. I wouldn't be getting to exited just yet but my view could change in a week, pending on the strength and if I can see it break through and close above this pennant pattern. We could possibly be in a distribution pattern where we could see a downside before we see a continued rising market.

All Ordinaries Index - Following 5 Consecutive Down DaysFor the 1st time since February 2020, the All Ordinaries Index (XAO) has closed lower for 5 consecutive days. The February 2020 episode didn't end well. However, one swallow does not a summer make.
Since 2000, XAO has fallen for 5 Consecutive Days (up or unchanged day followed by 5 down days) on 60 occasions. Following this weakness, XAO managed an average 20-day gain of 0.49%, with a win rate of 33 from 60 (median 0.42%, standard deviation 5.56%, series average return 0.43%). This type of weakness appears to lack any predictive quality & is consistent with random.

Correction ahead?Technical indicators are pointing towards a possible near term correction.
SP trading within a long term bearish ascending wedge pattern. (purple)
Short term bearish descending triangle forming. (red)
MACD showing bearish convergence. (white)
Shooting star candlestick shows excessive selling pressure.
Odds are in the favour of the bears.
Confirmation would probably be bearish candles through both the support (red) and trend line. (purple)
I'd be trading with caution.
All in my humble opinion
Thanks

Rough week for the all ords, could be a bounce next week though.Daily not looking good for the asx all ords, but if monday the stock market bounces to the green, we could see a weekly reversal in favour of the bulls. Weekly chart shows a reversal doji i feel, but only time will tell.
Not many winners out there this week, lets see how next week goes.


Irrational Exuberance - ASX - All Ords.The Market Can Remain Irrational Longer Than You Can Remain Solvent
2 TP targets. Fibonacci Ext.

ASX - Wave Revision - Ending Diagonal Wave VMapping out the exact waves in this ending diagonal in the Australian Stock Exchange.
Wave v is breaking back into the AriasWave pitchfork channel and will soon retest in Wave E of Wave (B) of this Expanding Type-2 Zig-Zag.
Once the final high is made just above the purple line and then dips back below it this should indicate a top.
Once it breaks back down and out of the AriasWave pitchfork channel this should confirm a top is in place.
Please LIKE and FOLLOW to get notification of updates and future posts.

XAO at resistancesee chart.
one recent fake out and a number of attempts to get out of the historic range.
